Figure 7.
Expression Analysis of TOE1 and TOE2.
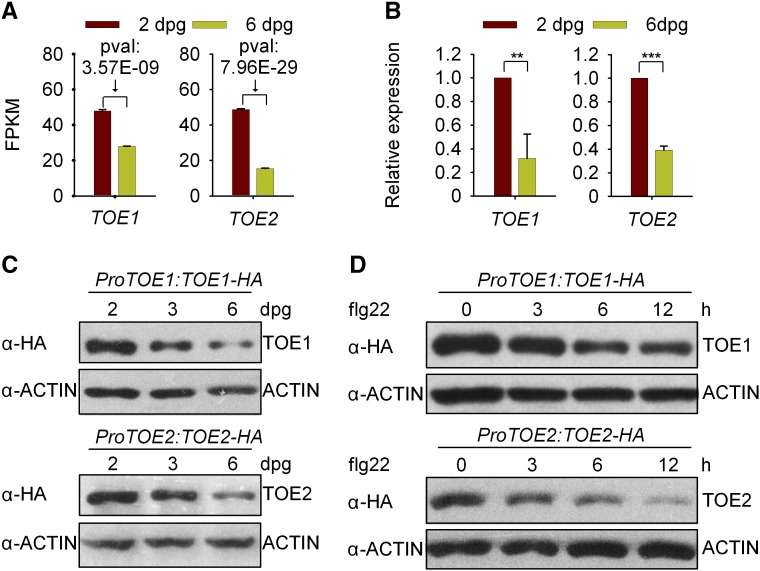
(A) The fragments per kilobase of transcript sequence per million base pairs sequenced (FPKM) of TOE1/2 during seedling development as determined by RNA-seq analysis. Values are means ± sd of two biological replicates. pval indicates the P value, which was adjusted using the Benjamini and Hochberg approach.
(B) Measurement of TOE1/2 transcript levels during seedling development by RT-qPCR. The transcript levels were normalized to those of GAPC. Values are means ± sd of three biological replicates using independent pools of seedlings grown under the same conditions. Statistical significance compared with 2-d-old Col-0 was determined by Student’s t tests: **P < 0.01 and ***P < 0.001.
(C) Immunoblotting analysis of TOE1/2 protein accumulation during seedling development. Total proteins were isolated from 2-, 3-, or 6-d-old ProTOE1:TOE1-HA or ProTOE2:TOE2-HA transgenic seedlings. ACTIN was examined as a loading control. These experiments were repeated three times with similar results.
(D) TOE1/2 protein levels were decreased upon flg22 treatment. Two-day-old transgenic seedlings were treated with 1 μM flg22 for the indicated times. These experiments were repeated three times with similar results.

