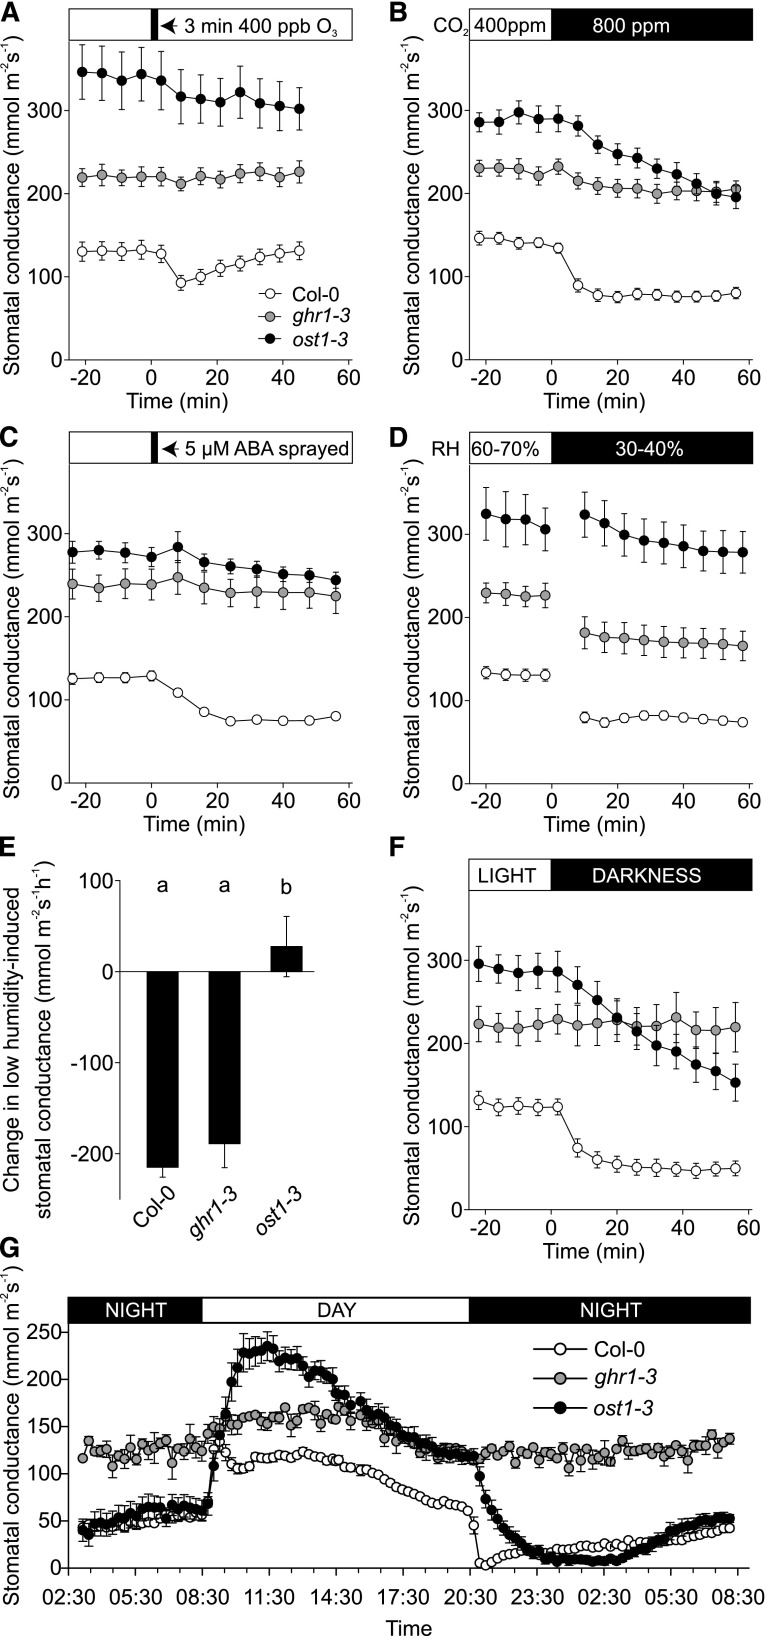
Figure 2.
Characterization of ghr1 Stomatal Phenotypes.
Time course of stomatal conductance of Col-0, ghr1-3, and ost1-3 plants in response to (A) O3 pulse, (B) elevated CO2, (C) ABA spray, (D) reduced air humidity, and (F) darkness. Stomatal conductance of 3- to 4-week-old plants was recorded; the indicated treatments were applied at time point zero. Data points represent means ± sem of at least three experiments (n = 8-21 plants). (E) Change in stomatal conductance 16 min after decrease in relative air humidity, calculated based on the data presented in (D). Significant differences (ANOVA with unequal N HSD as post hoc, P < 0.01) between groups are denoted with different letters. (G) Diurnal cycle in stomatal conductance of Col-0, ghr1-3 and ost1-3 plants. Stomatal conductance was recorded for two consecutive days, and diurnal stomatal conductance patterns for the second day are shown. Data points represent mean ± sem (n = 3–8 plants).

