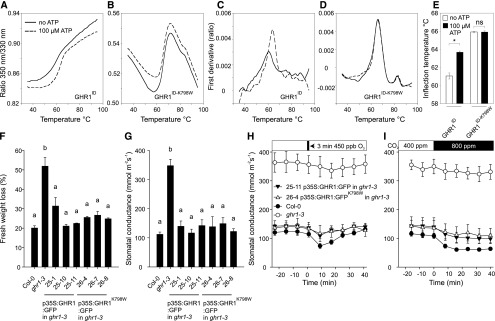
Figure 5.
Analysis of ATP Binding of GHR1ID and GHR1ID-K798W and Characterization of Stomatal Phenotypes in Independent Transgenic Lines Expressing 35S:GHR1:GFP or 35S:GHR1K798W:GFP in ghr1-3.
(A) and (B) Ratio of 350 nm/330 nm, which represents an unfolding transition of the proteins due to thermal treatment in the absence (solid lines) or presence (dashed lines) of ATP.
(C) and (D) The first derivative of the data presented in (A) and (B) showing a shift in inflection temperature upon ATP binding in the case of GHR1 intracellular domain (GHR1ID) (C), whereas in the case of GHR1ID-K798W, inflection temperatures are the same (D).
All experiments were repeated 6 times; representative curves are shown.
(E) Inflection temperatures for GHR1ID and GHR1ID-K798W in the absence or presence of ATP. The bars represent average value and standard deviations (n = 6). Asterisk denotes statistically significant difference between treatments (independent-samples t test, P < 0.05).
(F) Leaf fresh weight loss in 2 h and (G) stomatal conductance of intact plants. Data are presented as mean ± sem (n = 3-5 plants). Significant differences (ANOVA with Tukey’s HSD test, P < 0.05) between lines are denoted with different letters.
(H) and (I) Time course of stomatal conductance in response to (H) O3 pulse and (I) elevated CO2 in representative transgenic lines. Stomatal conductance of 3- to 4-week-old plants was recorded; the indicated treatments were applied at time point zero. Data points represent means ± sem (n = 3–5 plants).

