Figure 7.
Functional Domains of GHR1.
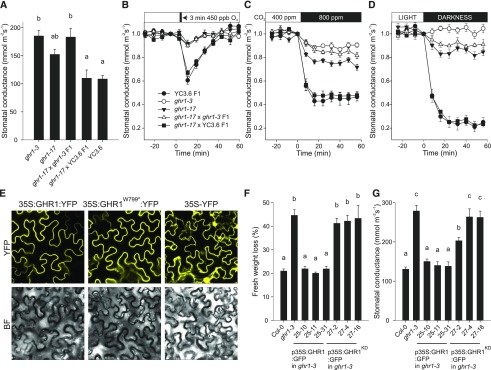
(A) to (D) Characterization of stomatal phenotypes of ghr1-17 and the F1 progeny from its cross to ghr1-3 (GK_760C07) and Col-0 with GC1:YC3.6. (A) Stomatal conductance of intact plants. Data are presented as mean ± sem (n = 5–7 plants) and derive from two independent batches of plants. Significant differences (ANOVA with Tukey’s HSD test, P < 0.05) between lines are denoted with different letters. (B) to (D) Stomatal response of intact plants to (B) O3 pulse, (C) elevated CO2, (D) darkness. Stomatal conductance (expressed in relative units) of 3- to 4-week-old plants was recorded; at time point zero, the indicated treatments were applied. Data points represent means ± sem (n = 5–7 plants).
(E) Subcellular localization of 35S:GHR1:YFP, 35S:GHR1W799*:YFP and 35S:YFP fusion proteins in Nicotiana benthamiana epidermal cells. Representative images for each construct taken with identical confocal microscopy acquisition settings are shown.
(F) Leaf fresh weight loss in 2 h and (G) stomatal conductance of intact plants in independent transgenic lines expressing 35S:GHR1:GFP or 35S:GHR1KD:GFP in ghr1-3. Data are pooled from two independent experiments and are presented as mean ± sem (n = 6–10 plants in [F], n = 6-8 plants in [G]). Significant differences (ANOVA with Tukey’s HSD test, P < 0.05) between lines are denoted with different letters.

