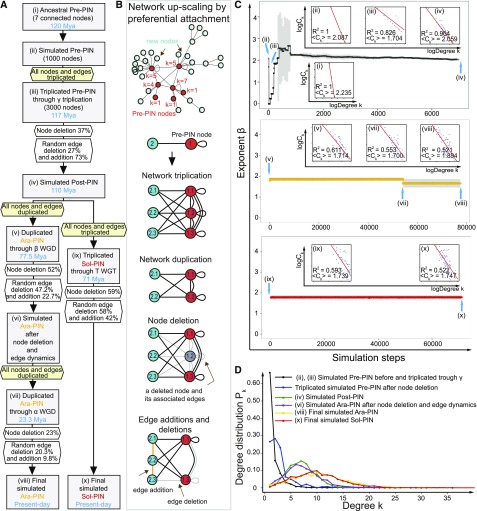
Figure 3.
Tracing Elementary Processes in Network Evolution from Pre-PIN until Extant Ara-PIN and Sol-PIN.
(A) The flowchart shows the initial up-scaled Pre-PIN model with the simulation process based on the actual ancestral and extant MADS-box PIN parameters (calculated percentages of node deletion, edge addition, and deletion). The initializing network is up-scaled to the size of 1000 nodes based on the actual Pre-PIN with 12 edges and seven connected nodes where two isolated nodes are excluded. Each simulation step reflects bins of 0.001 myr for random edge addition or deletion excluding the steps of ancient whole genome triplication or duplication and node deletions.
(B) Elementary processes of network evolution. The mechanisms of network up-scaling using preferential attachment in the initial up-scaled Pre-PIN model, network triplication, node deletion, and edge additions and deletions applied in the simulated networks. The ancestral Pre-PIN nodes are labeled in red while the new nodes are labeled in turquoise. All nodes are numbered and the number near the Pre-PIN nodes indicates their corresponding node degrees.
(C) Exponent β distribution for the initial up-scaled Pre-PIN model. The main plots show the average value of the β exponent together with the sd (plots in black, yellow, and red and error bars in gray) for a total 10 replicated simulations. Blue arrows indicate positions of several important simulated networks following the simulation steps corresponding to the simulation process from (A). There are a total of nine intrinsic log-log plots showing the relationship between degree k and Ck of each node in simulated MADS box PINs following the simulation steps (for the complete plots, see Supplemental Figure 4).
(D) Degree Pk distribution for the initial up-scaled Pre-PIN model.

