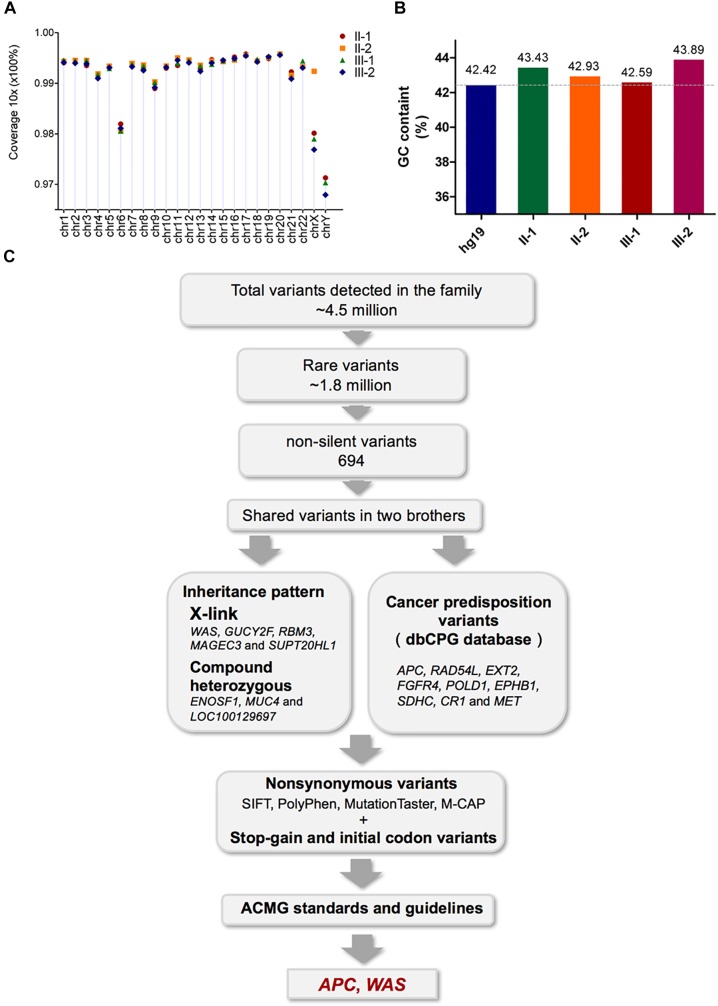
FIGURE 2.
Assessment of the WGS data quality of the four family members and validation of the pathogenic mutations by Sanger sequencing. (A) The percentage of 10-fold coverage for each sample is arranged by chromosomes. Overall, the average coverage for each chromosome and sample was higher than 96%. (B) Comparison of the average GC content for the WGS reads with the human reference genome (hg19). The average GC content for each sample was around 43%, and no significant bias was observed. (C) Workflow for the identification of pathogenic mutations.

