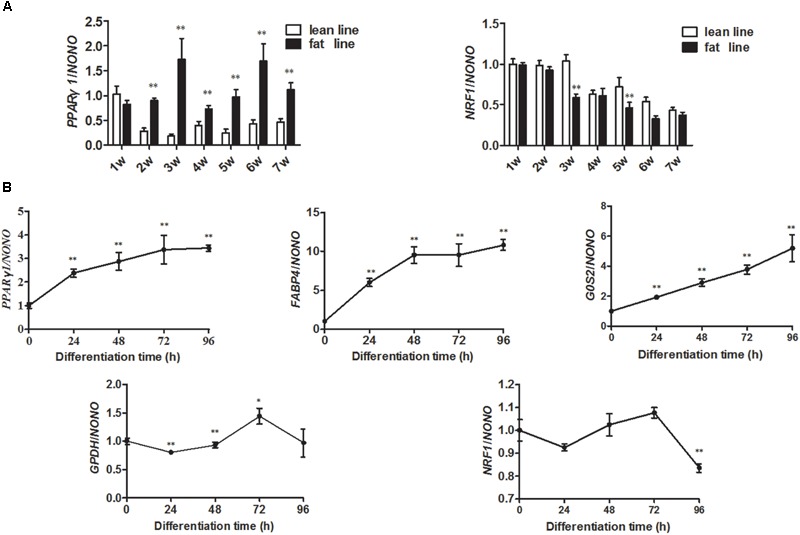
FIGURE 4.

Expression levels of PPARγ1 and NRF1 genes during chicken abdominal adipose tissue development and ICP1 cell differentiation. (A) Real-time RT-PCR analysis of the expression levels of PPARγ1 and NRF1 in the abdominal adipose tissues of NEAUHLF (each line, n = 5) from 1 to 7 weeks of age. Statistical significance was determined by Student’s t-test comparing lean to fat lines. ∗p < 0.05, ∗∗p < 0.01. (B) Real-time RT-PCR analysis of the expression levels of NRF1, PPARγ1 and adipogenic differentiation markers (FABP4, G0S2, GPDH, and AdipoQ) during differentiation of ICP1 cells. At 50% confluence, ICP1 cells were induced to differentiate by adding 160 μM sodium oleate with medium changes every 24 until 96 h of culture. The cells were harvested at 0, 24, 48, 72, and 96 h of differentiation. Chicken NONO was used as the internal control. The expression levels of PPARγ1, FABP4, G0S2, GPDH, and NRF1 at the indicated time points are expressed relative to the expression of the respective genes in ICP1 cells at 0 h of differentiation. All data represent the mean ± SE. Statistical significance was determined by Student’s t-test comparing expression at the indicated time points versus 0 h of ICP1 cell differentiation. ∗p < 0.05, ∗∗p < 0.01.
