Figure 3.
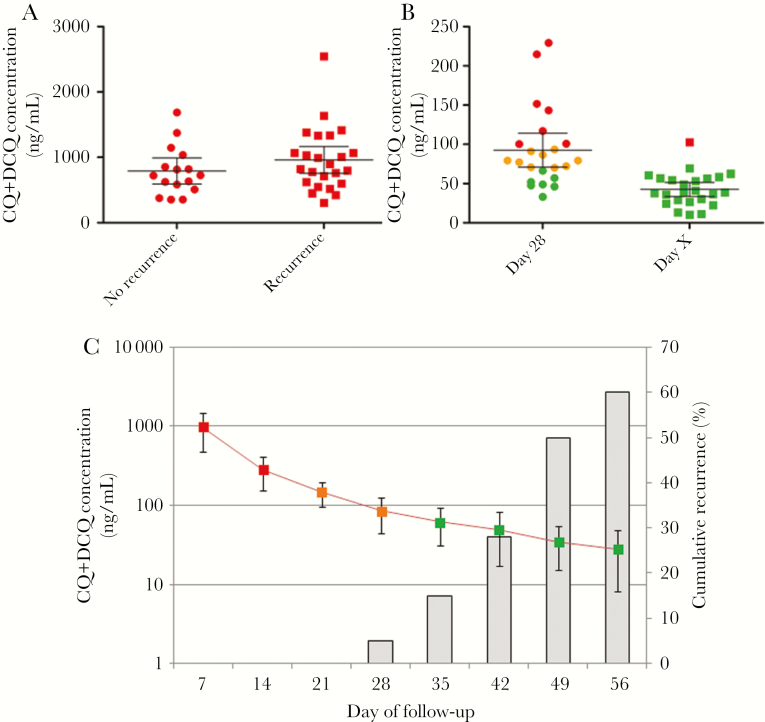
Whole-blood drug concentrations in Plasmodium vivax–infected patients receiving a 3-day supervised regimen of chloroquine (CQ; 30 mg/kg), Ratanakiri, Cambodia, 2014. Data are expressed as the sum of the concentrations of CQ and N-desethyl chloroquine (DCQ). A, Concentrations on day 7 for patients with and those without recurrences during the monitoring period. B, CQ blood concentrations on day 28 and the day of recurrence (detected by real-time polymerase chain reaction [PCR]) in patients experiencing recurrences during the 2-month monitoring period. C, Mean pharmacokinetic profile (±SD) over time (line) and cumulative proportion of parasite recurrences detected by real-time PCR (histograms). In panels A and B, CQ blood concentrations above the threshold for resistance (ie, 100 ng/mL) are in red, concentrations from 70 to 100 ng/mL are in orange, and concentrations <70 ng/mL are in green.

