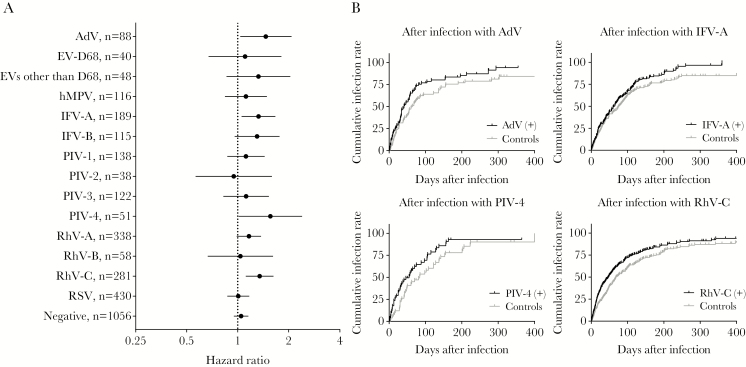
Figure 2.
Preceding viral infections and subsequent acute respiratory infections (ARIs). (A) Hazard ratios and 95% confidence intervals determined using Cox proportional hazards regression analysis are shown for subsequent ARIs after preceding infections compared with the first ARIs during the corresponding time for matched controls. A log scale was used for hazard ratios. (B) Cumulative infection rates by Kaplan-Meier curves are shown for subsequent ARIs after preceding infections and ARIs in matched controls during the corresponding period. The curves were shown for preceding infections with adenovirus, influenza A virus, parainfluenza virus type 4, and rhinovirus species C. Results for all viruses can be found in Supplementary Figure 2.

