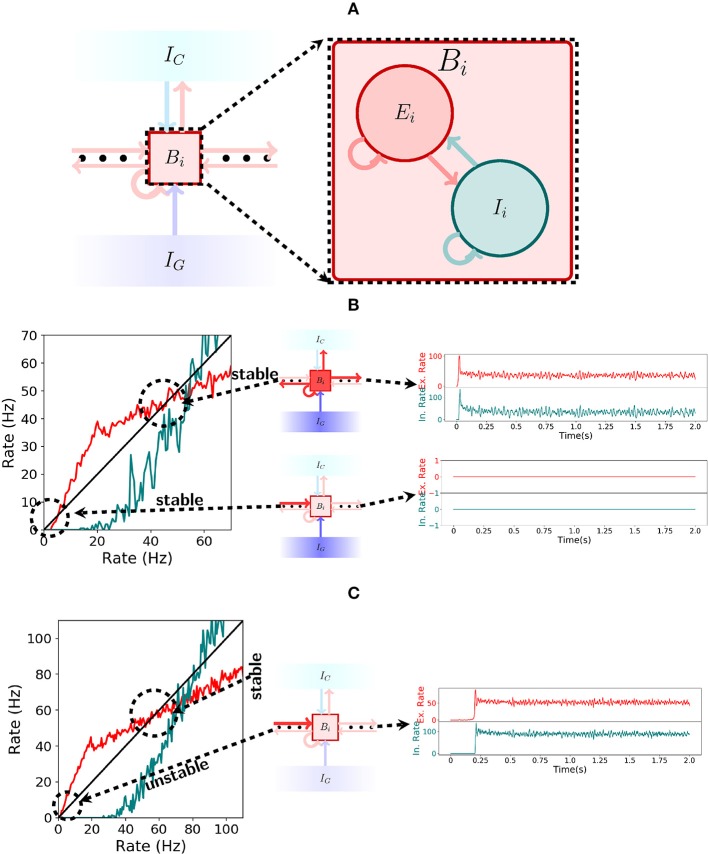
Figure 4.
Spiking network. (A) Illustration of a bistable unit consisting of both an excitatory and an inhibitory population. (B) On the left, the gain function of excitatory (red) and inhibitory(teal) neurons inside a bistable unit Bi is depicted. As shown in the center, if IG is turned on, then the shape of the gain function produces two stable states, one at 0Hz and another at approximately 50Hz. The stable states are shown on the right. (C) Analogous to (B), but now with IG turned off. As seen on the left, the gain function shape changes when receiving input from the previous pattern and the stable state at 0Hz ceases to exist. The network always settles for the only stable point around 50 Hz, a fact which is shown on the right.

