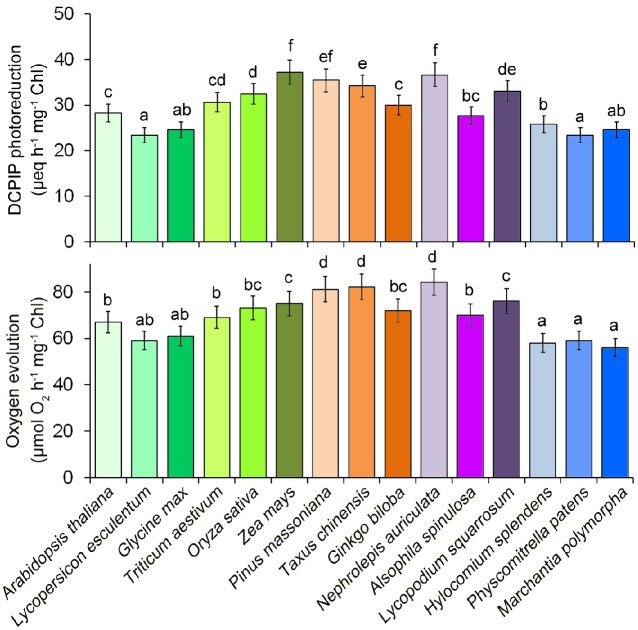
Figure 2.
Photosystem II photochemical functions from 15 plant species. Oxygen evolution rates were measured with 0.25 mM phenyl-p-benzoquinone under saturating light intensities. DCPIP photoreduction was determined with 60 mM DCPIP. Values are expressed as the means ± SD from three independent biological replicates (n = 3), and values followed by different letters are significantly different at p < 0.05 according to Duncan’s multiple range test.

