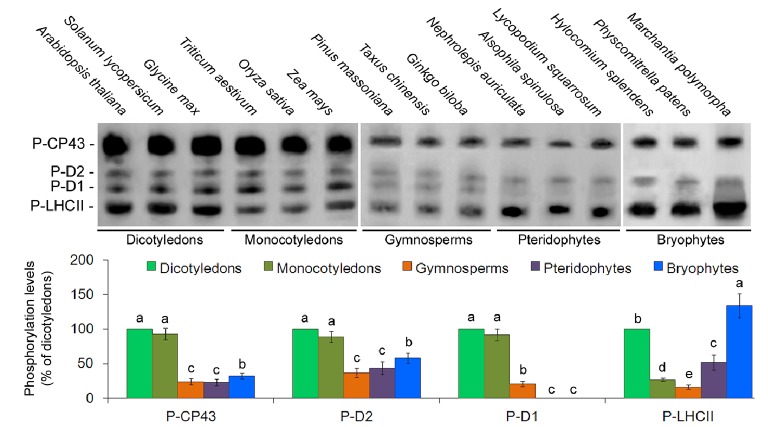
Figure 3.
Thylakoid protein phosphorylation pattern in 15 plant species. PSII phosphoproteins were analyzed with antiphosphothreonine antibodies. Quantification of thylakoid protein phosphorylation is presented below the blots. Values are expressed as the means ± SD from three independent biological replicates (n = 3), and values followed by different letters are significantly different at p < 0.05 according to Duncan’s multiple range test.

