Figure 4.
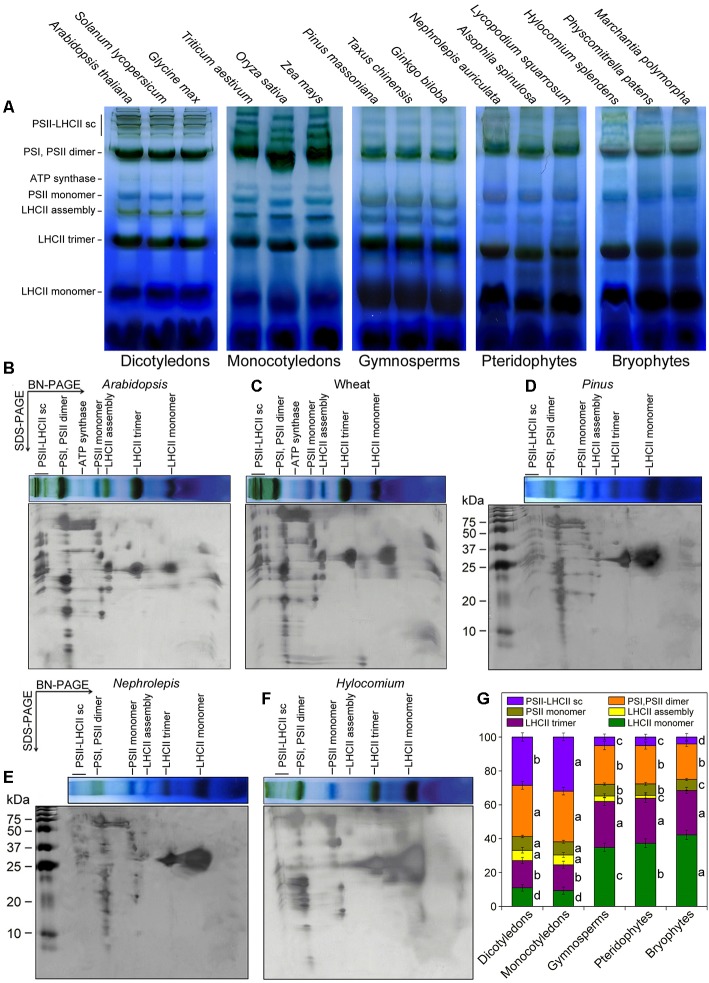
BN-PAGE analyses of thylakoid membrane protein complexes from 15 plant species. (A) BN-PAGE. Thylakoid membranes (20 μg of Chl) were solubilized with 1% DM in the presence of 5% PEG-6000 and separated by BN-PAGE. NDH, NAD(P)H dehydrogenase; mc, megacomplex; sc, supercomplex; Cyt, cytochrome. (B–F) Two-dimensional analyses of thylakoid membrane complexes from five typical plant species: Arabidopsis thaliana (B), wheat (C), Pinus massoniana (D), Nephrolepis auriculata (E), and Hylocomium splendens (F). The BN-PAGE strips were then loaded horizontally onto the top of a 15% SDS-PAGE gel, and the gel was subsequently silver-stained. The molecular mass markers (in kDa) are as indicated. (G) The quantitative analysis of thylakoid membrane complexes. Values are expressed as the means ± SD from three independent biological replicates (n = 3), and values followed by different letters are significantly different at p < 0.05 according to Duncan’s multiple range test.

