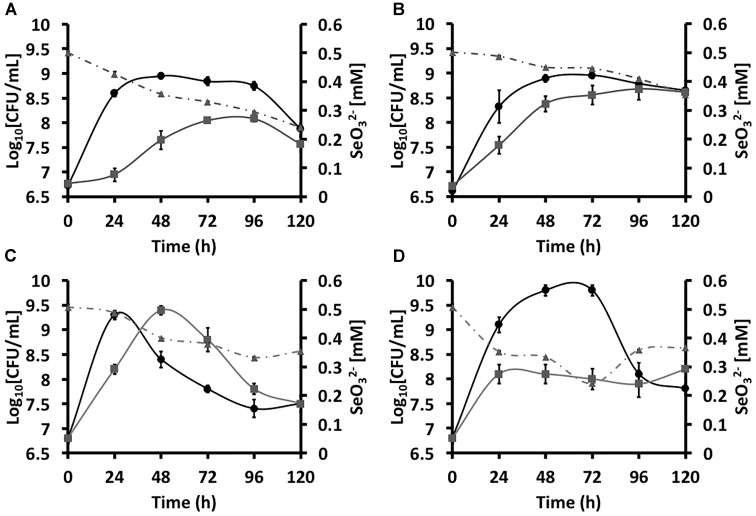
FIGURE 1.
Growtheee4 curvesddd5 of Stenotrophomonas maltophilia SeITE02 (A,B) and Ochrobactrum sp. MPV1 (C,D) in DM amended with glucose and/or pyruvate (black curves), and with the addition of 0.5 mM  (gray curves). The gray dashed curves represent the biotic conversion of
  over the timeframe considered.

