Image 1 .
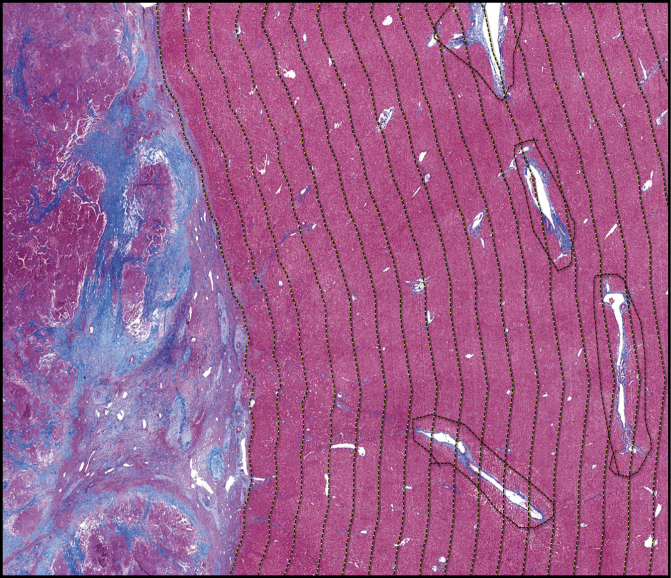
Annotations of peritumoral liver. Masson trichrome stain of section (×1) with tumor (left) and peritumoral tissue (right). The tumor border is manually annotated (leftmost dashed line) with 0.5-mm concentric intervals (yellow dashed lines) created in an automated fashion. Large vascular and portal spaces are manually annotated and excluded from the analysis (red dashed lines).

