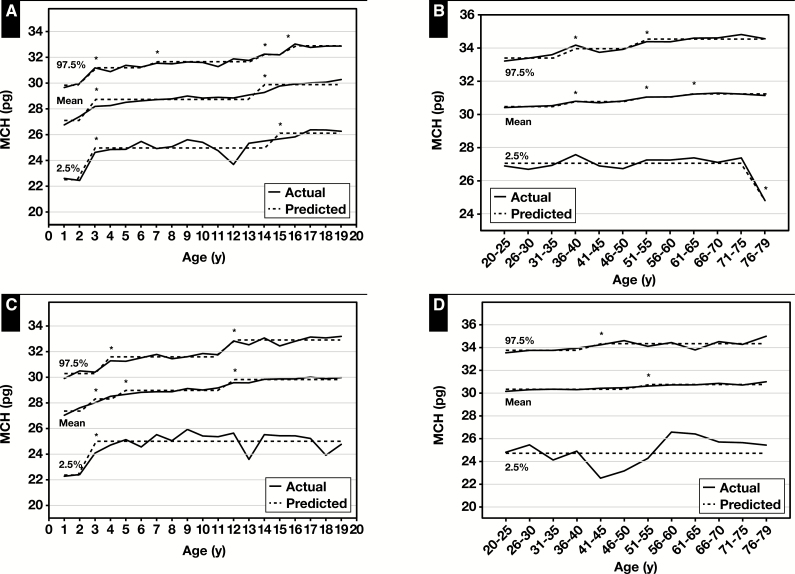
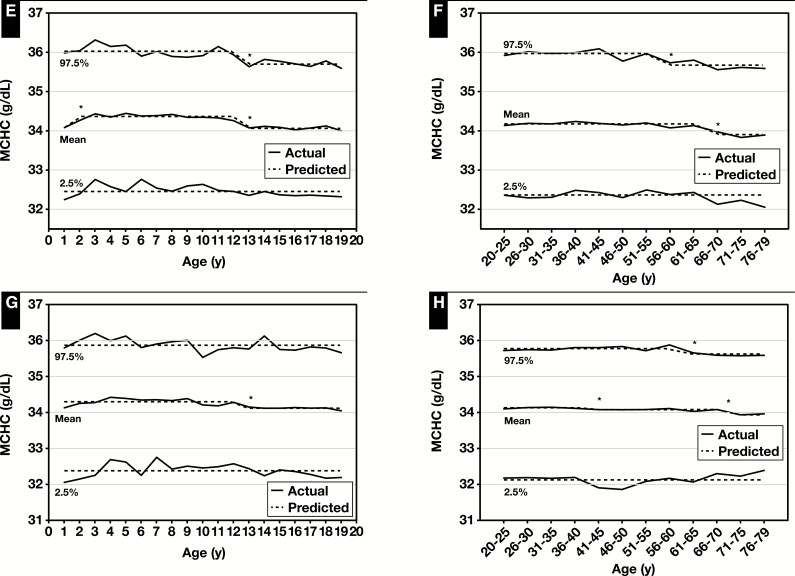
Figure 3 .
Actual and predicted (computed via piecewise regression) mean, lower reference limit (2.5th percentile values) and upper reference limit (97.5th percentile values) for mean cell hemoglobin (MCH) in male (A) and female (C) children and male (B) and female (D) adults. Also for mean cell hemoglobin concentration (MCHC) in male (E) and female (G) children and male (F) and female (H) adults. Data from National Health and Nutrition Examination Survey 1999 to 2012 (supplemental data). *Significant breakpoint detected using piecewise regression, P ≤ .01.


