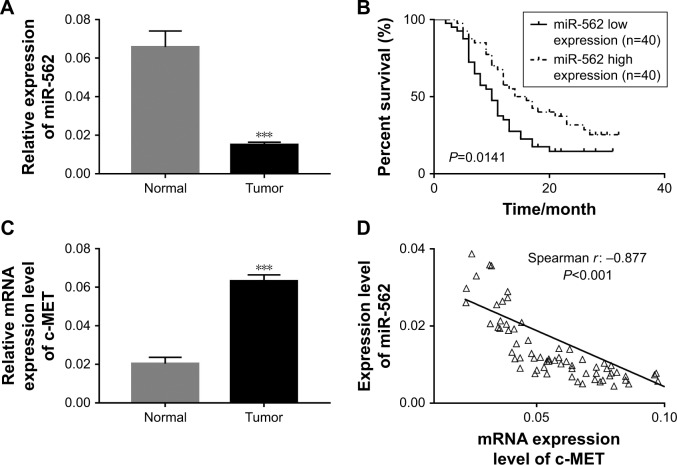
Figure 1.
The negative correlation between miR-562 and c-MET in GBM tissues.
Notes: (A) The miR expression level of miR-562 in GBM tissues (n=80) and para-cancerous tissues (n=16). ***P<0.001 vs normal. (B) The overall survival time of 80 patients with GBM. (C) The mRNA expression level of c-MET in GBM tissues (n=80) and para-cancerous tissues (n=16). ***P<0.001 vs normal. (D) Correlation between the expression of miR-562 and c-MET in GBM samples.
Abbreviations: GBM, glioblastoma; miR, microRNA.

