Figure 1.
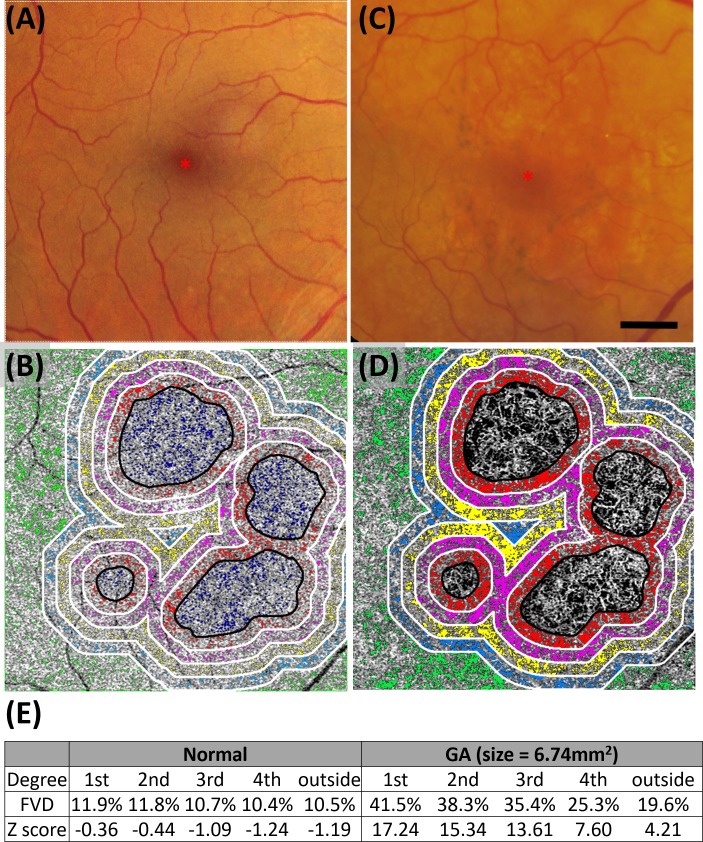
Representative color fundus and OCTA images of normal subject N2, 40019R (A, B) and patient P5, 40128R (C, D). Color fundus photo of N2 (A) shows several patches of RPE depigmentation but no drusen were present on OCT B-scans, while P5 (C) shows drusen, areas of GA, and focal RPE hyperplasia. Color photos were scaled to match the 6 mm × 6 mm OCTA images in (B) and (D). FVs within five color coded regions that extend in 1° concentric bands from the margin of GA are overlaid onto the CC OCTA maps obtained from (B) normal and (D) GA subjects: 1st band, 0° to 1° (red); 2nd band, 1° to 2° (magenta); 3rd band, 2° to 3° (yellow); 4th band, 3° to 4° (blue); and outside, greater than 4° (green). GA regions are outlined in black. Colored pixels in (B) and (D) indicate regions of the CC flow void, defined as greater than 1 standard deviation below the mean of 20 normal subjects aged 20 to 39 years.20 (E) CC flow void percentage across the bands and Z-scores for each of the 5 bands. Red asterisks show the foveal center; scale bar: 1 mm.

