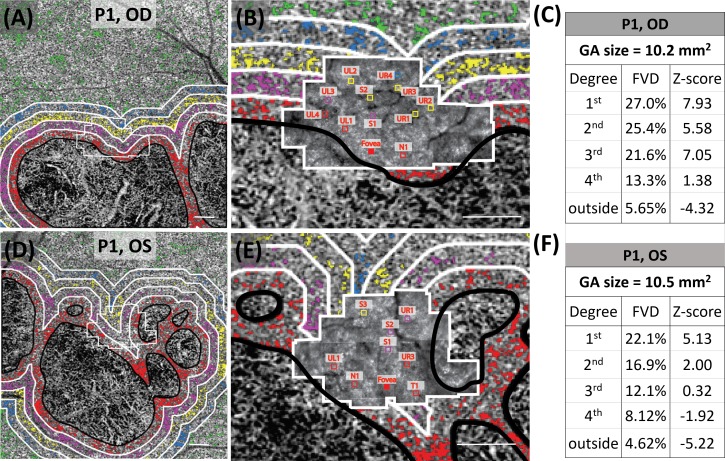
Figure 3.
Representative OCTA CC images in 2 eyes (P1, OU: OD, top row; and OS, bottom row) with AMD. The CC FVs are shown as colored pixels in regions extending from the GA margin in concentric 1° color-coded bands, labeled 1st to 4th°, with outside representing the region greater than 4° from the GA margin (black outlines), and AOSLO images with ROIs where cone spacing was measured. GA area and drusen were excluded from the CC flow void analysis. (A, D) CC images with color-coded FVs. (B, E) AOSLO images with ROIs extending 50 μm × 50 μm labeled with letters and numbers indicating relative position with respect to the fovea. UL, upper left; UR, upper right; LL, lower left; LR, lower right; N, nasal; T, temporal; S, superior; P, patient. Scale bars: 500 μm. (C, F) GA area, CC FVD, and Z-scores for each of the 5 regions extending from the GA margin as follows: 1st, 0° to 1° (red); 2nd, 1° to 2° (magenta); 3rd, 2° to 3° (yellow); 4th, 3° to 4° (blue); outside, greater than 4° (green) from the GA margin. Images from patients P2 OS and P3 OS are shown in Supplementary Figure S4, P4 OD and P5 OD in Supplementary Figure S5, and P5 OS and P6 OD are shown in Supplementary Figure S6.

