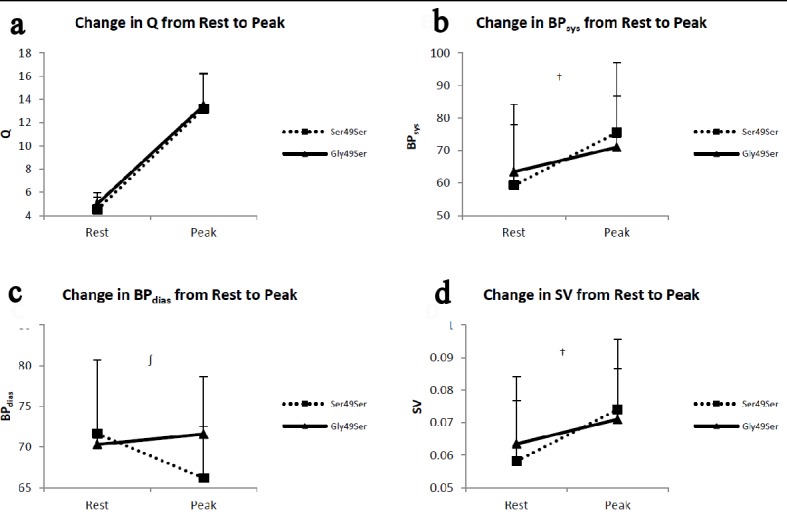
Figure 1.

Panels depict the change from rest to peak exercise in (a) cardiac output (Q), (b) systolic blood pressure (BPsys), (c) diastolic blood pressure (BPdias), and (d) stroke volume (SV). The error bars represent the SE of the mean. †Possible trend towards significance for change in BPsys (P = 0.08) and SV (P = 0.058) from rest to peak between genotype groups. ∫Clinically significant difference between genotype groups for change in BPdias from rest to peak exercise (-5.5 ± 15.4 and 1.3 ± 11.5 for Ser49Ser and Gly49Ser, respectively).
