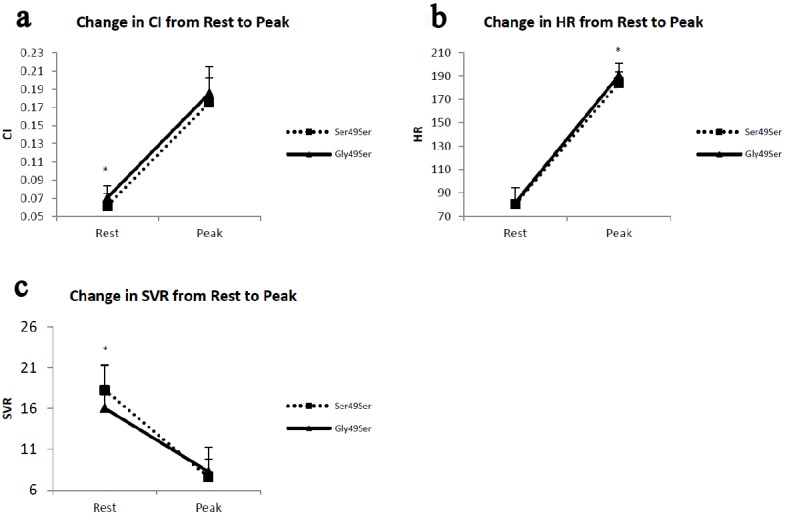
Figure 2.

Panels depict the change from rest to peak exercise in (a) cardiac index (CI), (b) heart rate (HR) and (c) systemic vascular resistance (SVR). The error bars represent the SE of the means. *P < 0.05 for Ser49Ser vs. Gly49Ser pairwise comparisons.
