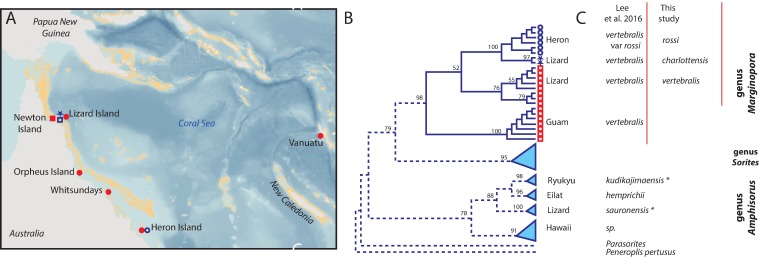
Fig 1.
Summary diagram showing the research area (A), the phylogram of [8]; B), and the re-interpretation of the results of [8] in this study (C). In A and B circles indicate collections made at the reef base or inter reef, squares collections made at the reef flat, and open symbols include collections included in [8], closed symbols collections included in this study. Finally, the stars indicate the two specimens from Heron island sequenced by [12].

