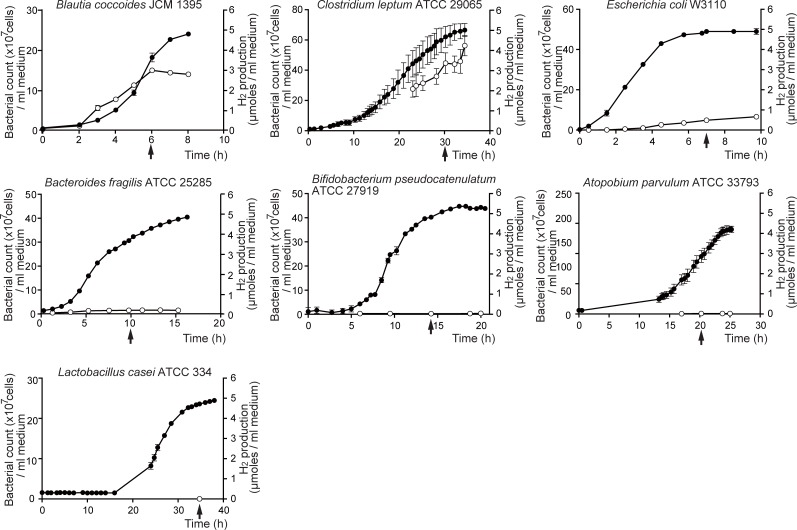
Fig 1. Temporal profiles of the number of bacteria (closed circles) and hydrogen production (open circles).
The numbers of bacteria per ml culture medium are plotted on the left axis (closed circles). The hydrogen concentration was quantified by a gas chromatography, and the number of hydrogen molecules per ml culture medium was calculated and plotted on the right axis (open circles). Arrows point to the transition between the growth and stationary phases when the hydrogen concentration accumulated in the gaseous phase was used to calculate the hydrogen production. Note that scales on the right vertical axes are identical, whereas scales on the left vertical axes and on the horizontal axes are different. Mean and SD are indicated (n = 3 or 4 culture tubes).

