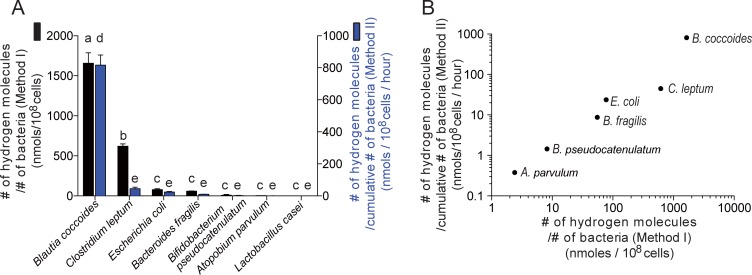
Fig 2. The amount of hydrogen production by seven intestinal bacteria.
The amount of hydrogen production was normalized in two ways. Black bars represent the hydrogen production normalized by the number of bacteria at the transition between the growth and stationary phases (arrows in Fig 1) (Method I). Blue bars represent the hydrogen production normalized by the cumulative number of bacteria from time zero to the transition between the growth and stationary phases (arrows in Fig 1) (Method II). The normalized hydrogen productions are indicated in a bar graph on a linear scale (A) and in a scattered plot on a logarithmic scale (B). (A) Mean and SD are indicated (n = 3 or 4 culture tubes). P values by one-way ANOVA are < 0.0001 for both Methods I and II. Different symbols in Methods I (a, b, and c) and II (d and e) indicate p < 0.05 by Tukey-Kramer posthoc test. (B) The Pearson’s correlation coefficient between Methods I and II is 0.950 (p = 0.001). Note that Lactobacillus is not plotted because the hydrogen production was not detected.

