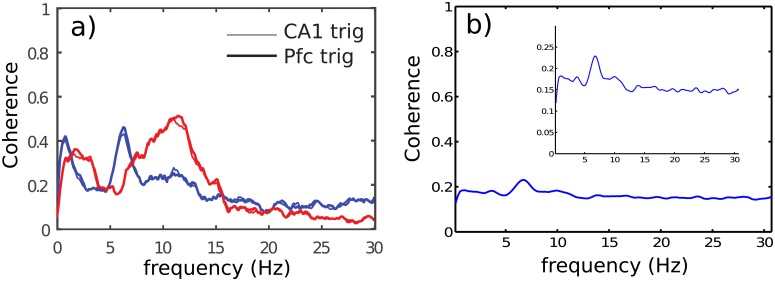
Fig 8.
a) Coherence between CA1 and PFC during REM sleep for the two recording modes RR (blue) and DR (red). Triggering source: Thin traces correspond to a trigger according to CA1, while large traces correspond to a trigger according to PFC. b) Imaginary Coherence between CA1 − PFC in RR configuration, showing the decrease of the 7 Hz peak as well as the very low frequency peak, because volume conduction is mainly represented by the real part. The 10 Hz to 15 Hz frequency band stays absent because of the poor signal to noise ratio in RR configuration. Inset: vertical zoom of the coherence index.

