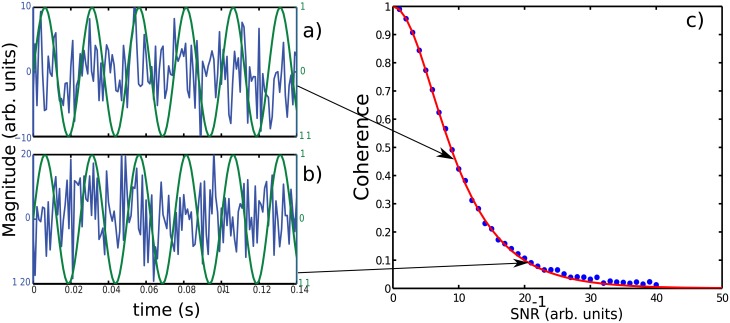
Fig 10. Coherence index vs noise to signal ratio (SNR−1).
a) and b): The coherence calculations have been performed between a pure sine wave (green line) of unit amplitude vs itself added to a gaussian white noise where the magnitude has been chosen to 10 and 20 respectively for a) and b). c) The coherence index decreases rapidely with SNR−1 according to a hyperbolic secant law (red line). Arrows point out the coherence level corresponding respectively to a SNR−1 = 10 and 20.

