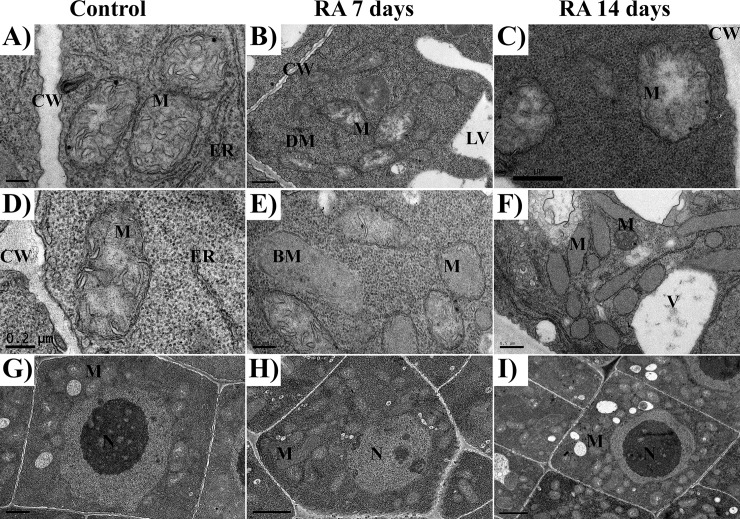
Fig 3. TEM images of mitochondria in rosmarinic acid-treated and untreated Arabidopsis meristems.
TEM images of the apical meristem of control (A, D), and 7 (B, E) and 14 days (C, F) RA-treated (175 μM) Arabidopsis roots: A, D) mitochondria from control cells; B, C) mitochondria from 7 and 14 days treated cells, it should be noted the presence of translucent stroma; E) mitochondria from 7 days treated cells, it should be noted the presence of broken mitochondria and the reduced number of cristae; F) mitochondria from 14 days treated cells characterized by a strong reduction in the number of cristae; G-I) Control cell (G), 7 days (H) and 14 days (I) RA-treated cells, should be noted the high increment in mitochondria number in treated cells compared to control cell. Cell wall (CW), lytic vacuole (LV), mitochondria (M), dividing mitochondria (DM); broken mitochondria (BM); endoplasmic reticulum (ER), Golgi apparatus (G).

