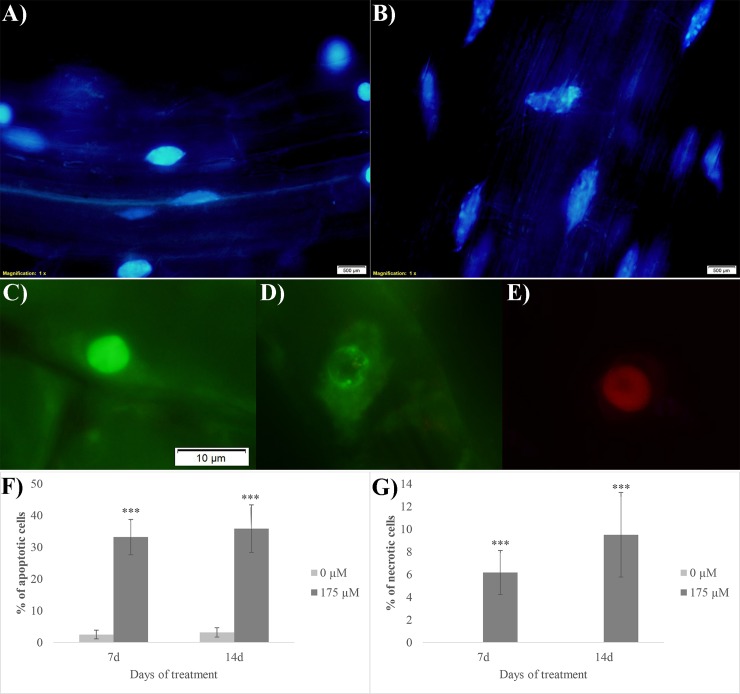
Fig 7. Cell death evaluation on rosmarinic acid-treated A. thaliana root meristem.
Images of cells double stained with DAPI (A-B) and acridine orange/ethidium bromide (C-E): A) nuclei of the control cells stained with DAPI, B) nuclei of the RA-treated cells stained with DAPI with fragmented chromatin, C) viable nuclei, D) early apoptotic cells, E) necrotic cells. Similar images were observed in both 7 days and 14 days RA-treated roots. F) % of apoptotic cells (evaluated as number of apoptotic cells/100 cells); G) % of necrotic cells (evaluated as number of necrotic cells/100 cells). Asterisks indicate significant differences compared to the control: * (P ≤ 0.05), ** (P ≤ 0.01), *** (P ≤ 0.001); data were analyzed through t-test with P ≤ 0.05. N = 3.

