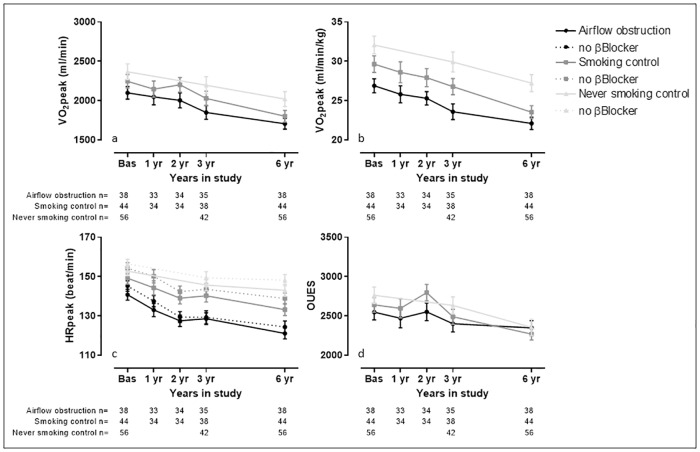
Fig 2. Visual representation of the comprehensive measures of cardiovascular fitness measured during the study.
Data are presented as average and standard deviation. Panel a) peak oxygen uptake (VO2peak), in mililiters per minute; b) VO2peak, in milliliters per minute per kilogram of body weight; c) peak heart rate (HRpeak); d) oxygen uptake efficiency slope (OUES). The Airflow obstruction group is presented by dots and a black line, the smoking control group is presented by squares and a dark grey line and the never smoking control group is presented by triangles and a light grey line. The analysis of HRpeak was performed including all subjects (solid line) and excluding those who were under beta blocker therapy in any of the tests (dotted line) (‘no βBlocker’- Airflow obstruction n = 23, Smoking control n = 32, Never smoking control n = 43).

