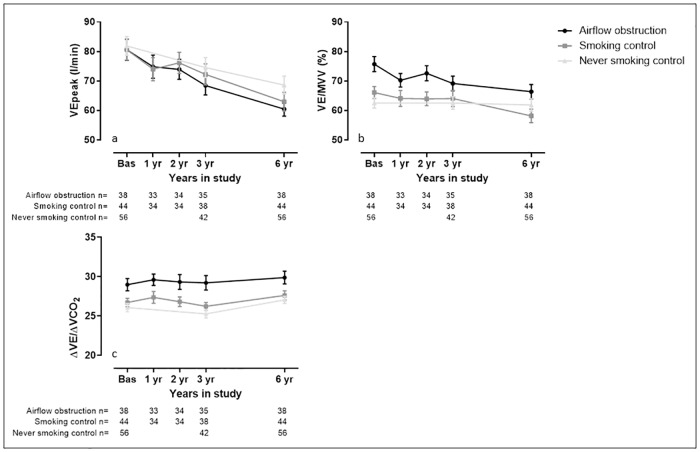
Fig 3. Visual representation of the ventilatory related measures assessed during the study.
Data are presented as average and standard deviation. Panel a) peak minute ventilation (VEpeak); b) ventilatory reserve (VE/MVV); c) ventilatory efficiency slope (ΔVE/ΔVCO2). The Airflow obstruction group is presented by dots and a black line, the smoking control group is presented by squares and a dark grey line and the never smoking control group is presented by triangles and a light grey line.

