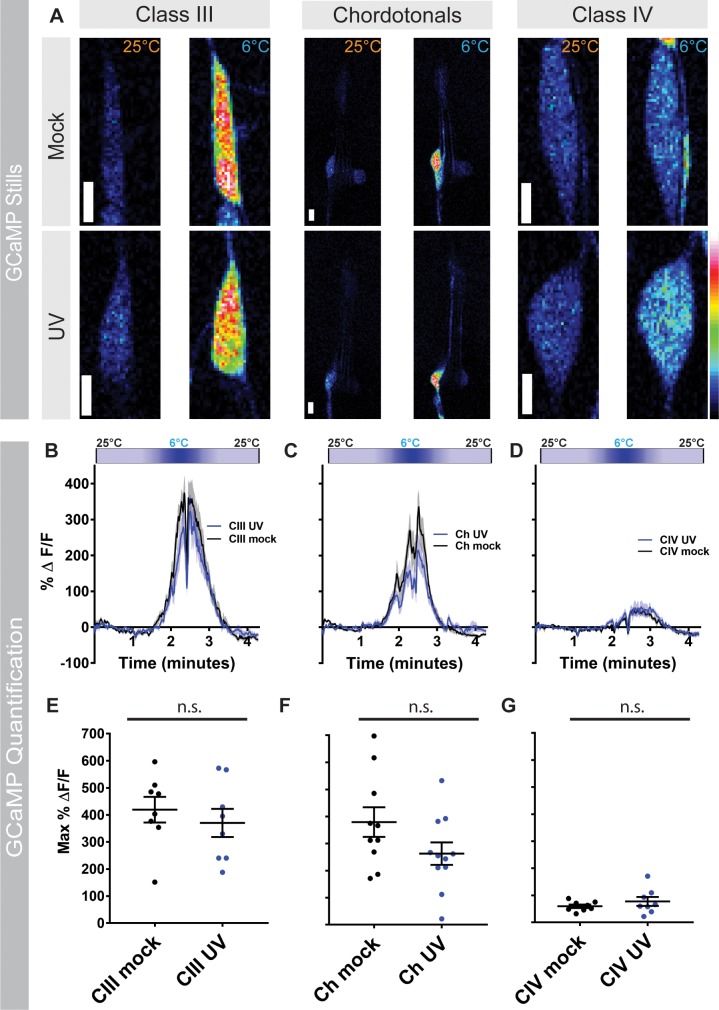
Fig 4. UV irradiation does not alter cold-evoked calcium responses.
(A) in vivo confocal stills of larval CIII, Ch, and CIV sensory neurons expressing GCaMP6m at 25°C and 6°C in mock treated larvae and 24 hours post UV treatment. Scale bar: 5 μm. (B-D) Change in GCaMP6m fluorescence (ΔeltaF) over time for (B) CIII, (C) Ch, and (D) CIV sensory neurons. Cold-map on top of each graph represents stimulus temperature. Data represented as mean GCaMP6 response (black and blue trace lines) ± s.e.m (grey). (E-G) Max change in GCaMP6m fluorescence for mock- and UV-treated larvae 24 hours post-irradiation for (E) CIII, (F) Ch, and (G) CIV sensory neurons, Data are presented as mean ± s.e.m., n = 8–11 larvae. Stats: Two-tailed t-test (E-G), where the comparisons are between mock and UV treated conditions. n.s. = not significant.

