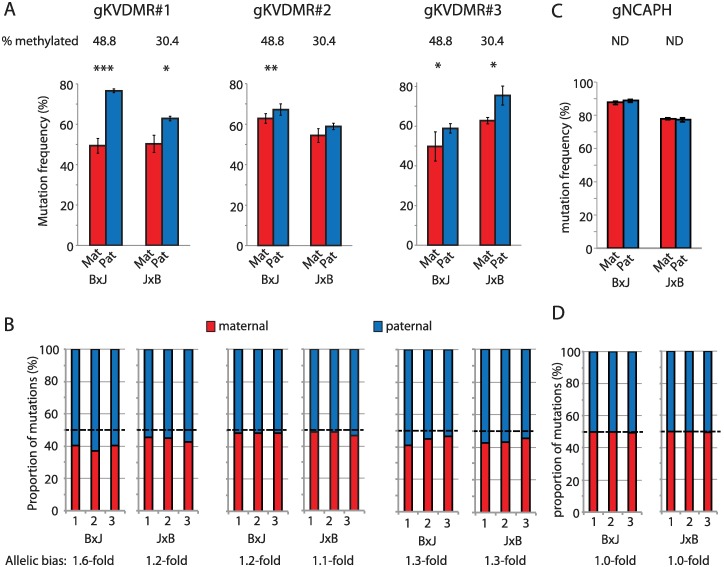
Fig 2. Lower mutation frequency on silenced alleles following 96-hour exposure.
(A) Allele-specific mutation frequencies for KvDMR sgRNAs #1–3 in cells harvested 96 hours post transfection, following selection of transfectants in puromycin. Error bars represent SD of three biological replicates; p-values denote two-tailed paired t tests of difference between maternal and paternal alleles. *p < 0.05, **p < 0.01, ***p < 0.001. In this, and subsequent figures, the percentage of hypermethylated alleles in mock-transfected cells is shown above the histogram to indicate the degree of imprinting at the time of editing. (B) Stacked histograms show the allelic mutation bias in each experimental replicate. (C, D) Allele-specific mutation frequencies from experiments using an sgRNA (sgNCAPH) targeting a nonimprinted locus, presented as described in panels A and B. Quantitative data underlying all panels are provided in S1 Data, and details of MiSeq libraries including SRA accessions are provided in S2 Data. Mat, maternal; ND, methylation analysis not done; Pat, paternal; sgRNA, single guide RNA; SRA, Sequence Read Archive.

