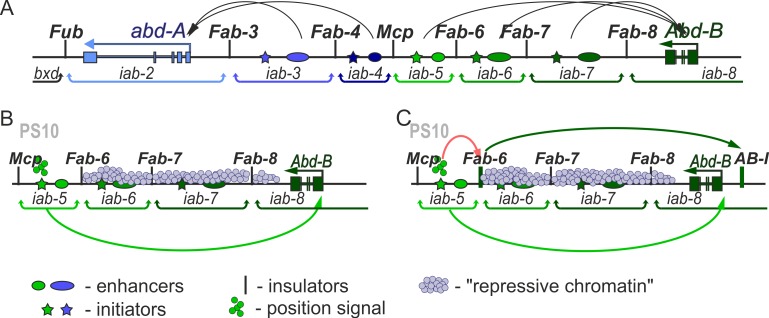
Fig 1. Models of an enhancer–promoter interactions in BX-C.
(A) Scheme of the regulatory region of the distal part of the BX-C. Horizontal arrows represent transcripts for abd-A (blue) and Abd-B (green). iab enhancers are shown as ovals color-coded with respect to the gene they control (darker shades of color indicate higher expression levels). The black arc arrows are a graphical illustration of the targeting of each cis-regulatory domain to the abd-A or Abd-Bm promoter. Vertical lines mark boundaries (Fub, Fab-3, Fab-4, Mcp, Fab-6, Fab-7, and Fab-8) of regulatory iab domains which are delimited by brackets behind the map. (B) and (C) Schematic representation of the models explaining interaction of the iab enhancers with the Abd-B promoter. (B) After stimulation of the initiator (colored star) by a positional signal (small circles with the same color as initiator), the iab enhancer directly interacts with the Abd-B promoter. This process is shown as light green arc arrow. Domains without positional signal are repressed (shown as light blue small circles across the domain, indicating "repressive chromatin"). (C) Boundary is directly involved in organization of the enhancer-promoter interactions. There is also a boundary-like element AB-I upstream of the Abd-B promoter that has communicator activity in bypass assays. Proteins of the positional signal bind with initiator of iab domain, and its active status modifies the boundary activity. This process is shown as red arc arrow. Boundary becomes able to bind proteins responsible for communication with AB-I. Interaction is shown as dark green arc arrow. As a result, the iab enhancer is localized in close proximity to the Abd-B promoter (shown as light green arc arrow).

