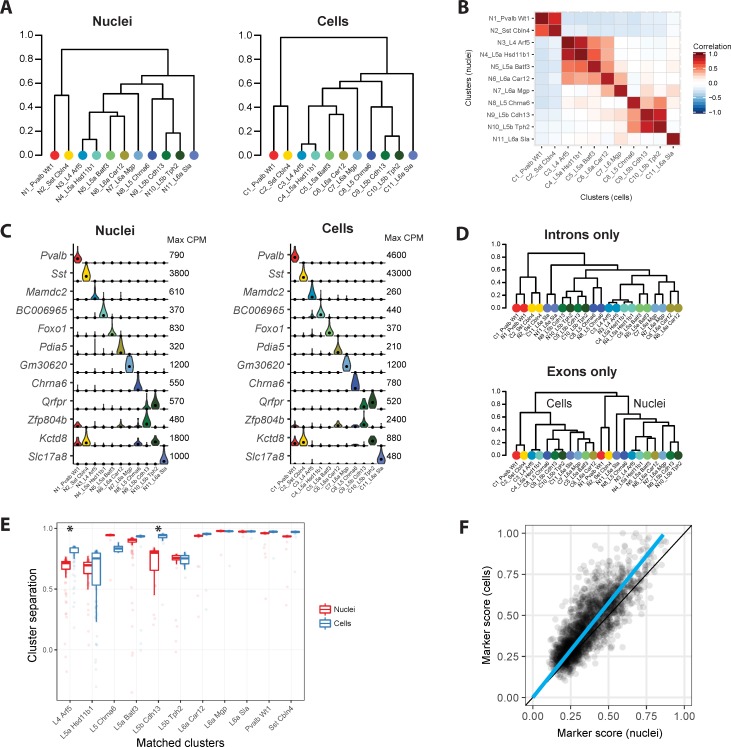
Fig 4. Similar neuronal cell types identified with nuclei and cells.
(A) Cluster dendrograms for nuclei and cells based on hierarchical clustering of average expression of the top 1200 cluster marker genes. 11 clusters are labeled based on dendrogram leaf order and the closest matching mouse VISp cell type described in based on correlated marker gene expression (see S4 Fig). (B) Pairwise correlations between nuclear and cell clusters using average cluster expression of the top 490 shared marker genes. (C) Violin plots of cell type specific marker genes expressed in matching nuclear and cell clusters. Plots are on a linear scale, max CPM indicates the maximum expression of each gene, and black dots indicate median expression. (D) Hierarchical clustering of nuclear and cell clusters using the top 1200 marker genes with expression quantified by intronic or exonic reads. Intronic reads group nine matching nuclear and cell clusters together at the leaves, while two closely related deep layer 5 excitatory neuron types group by sample type. In contrast, exonic reads completely segregate clusters by sample type. (E) Box plots of cluster separations for all samples in matched nuclear and cell clusters. Clusters are equally well separated for all but two cell types, L4 Arf5 and L5b Cdh13, that are moderately but significantly (Wilcoxon signed rank unpaired tests; Bonferroni corrected P-value < 0.05) more distinct with cells than nuclei. (F) Cell type marker genes are consistently detected in both nuclei and cells, although marker scores (see Methods) are on average 15% higher for cells.

