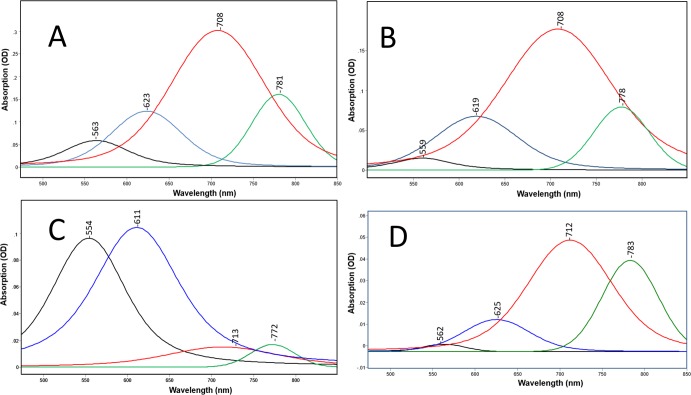
Fig 3.
A-D. Curve fitted components of absorption spectra shown in Fig 2 for GPR-DNFS:MR at different pHs. (A) GPR-DNFS:MR at pH 5 in hydrated film; (B) GPR-DNFS:MR at pH 7.3 in hydrated film; (C) GPR-DNFS:MR at pH 9.5 in hydrated film; and (D) same as B but suspension measured in aqueous buffer (see Materials and Methods). All spectra are scaled to the largest component peak. Curve fitted components are colored black, blue, red and green from lowest to highest wavelength of component peak maxima. See Materials and Methods for details of curve fitting method.

