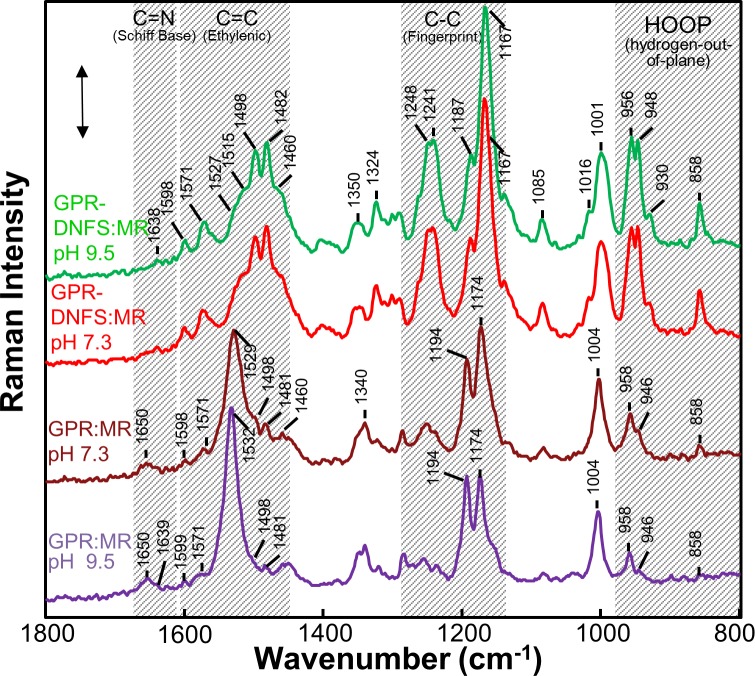
Fig 4. FT-Raman spectra recorded using 1064-nm excitation of GPR:MR and GPR-DNFS: MR at differ pHs in reconstituted membrane vesicles.
The GPR:MR spectra at the different pHs were scaled using the 1194 cm-1 band and the GPR-DNFS:MR spectra at the different pHs were scaled using the 1167 cm-1 band. Laser power and data acquisition times for each sample were GPR-DNFS:MR pH 7.3 (300 mW, 120 min), GPR-DNFS pH 9.5 (300 mw, 113 min); GPR:MR pH 7.3 (400 mW, 113 min); GPR:MR pH 9.5 (400 mW, 226 min). The scale bar shown is for the GPR-DNFS MR pH 7.3 spectrum and corresponds to 0.005 FT-Raman intensity measured by a Ge detector (see Materials and Methods for additional details).

