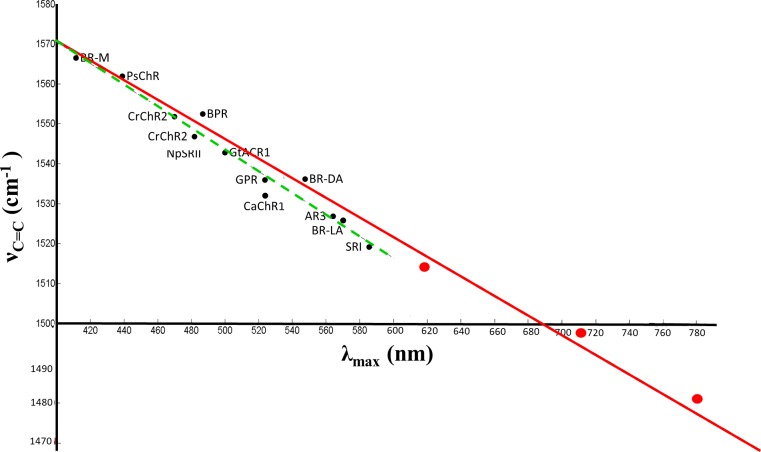
Fig 5. Inverse linear correlation between ethylenic frequency and visible absorption wavelength maximum for several microbial rhodopsins and GPR-DNFS:MR.
All wavelength and frequency values for GPR-DNFS:MR (large red dots) are from results reported here (Figs 3 and 4). Additional data points (black dots) include CaChR1, CrChR2, NpSRII, light-adapted BR [53], light-adapted AR3 [47]; dark-adapted BR [63]; BR M-intermediate [40, 64]; BPR;GPR [46]and SRI [65]. Red solid line shows linear correlation based on visual fit for the GPR-DNFS:MR data. The green dashed line shows the linear correlation previously reported for only visible absorbing microbial rhodopsins. Adapted from Supplementary S3 Fig from [53].

