Fig. 2.
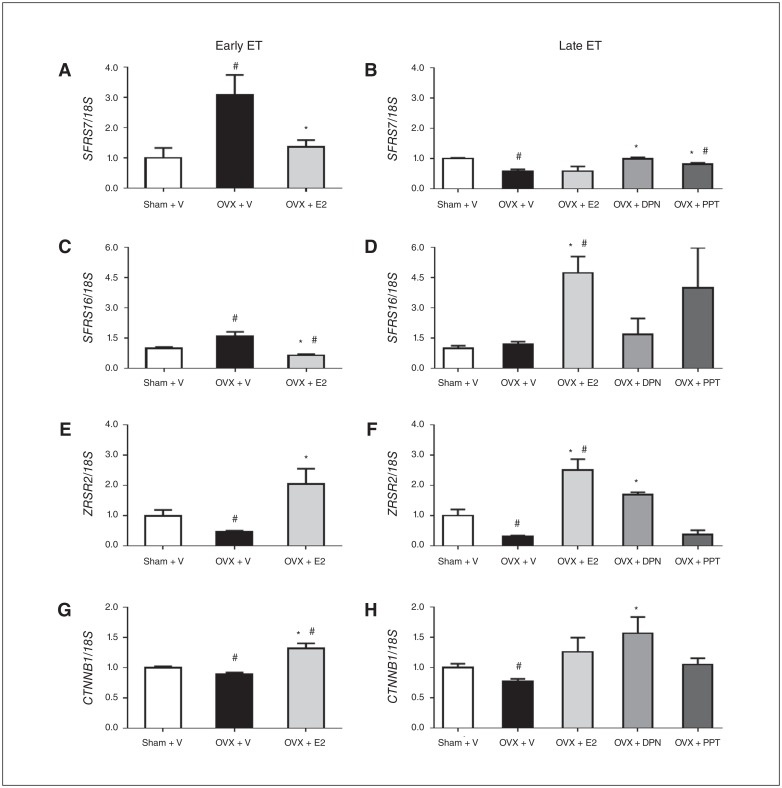
E2 and ER-specific agonists regulate mRNA expression of splicing factors. We measured SFRS7, SFRS16, ZRSR2 and CTNNB1 gene expression in frontal cortex using real-time qPCR with 18S rRNA expression as an internal control from rats receiving vehicle or E2 6 days post-OVX (A, C, E, G) or from rats receiving vehicle, E2, DPN or PPT 180 days post-OVX (B, D, F, H). Data were analyzed using 1-way ANOVA and a subsequent Bonferroni post hoc test, and are presented as mean ± SEM. #p < 0.05 v. sham + V; *p < 0.05 v. OVX + V. ANOVA = analysis of variance; DPN = diarylpropionitrile; E2 = estradiol; ER = estrogen receptor; ET = estrogen therapy; OVX = ovariectomy; PPT = propylpyrazoletriol; qPCR = quantitative polymerase chain reaction; SEM = standard error of the mean; V = vehicle.

