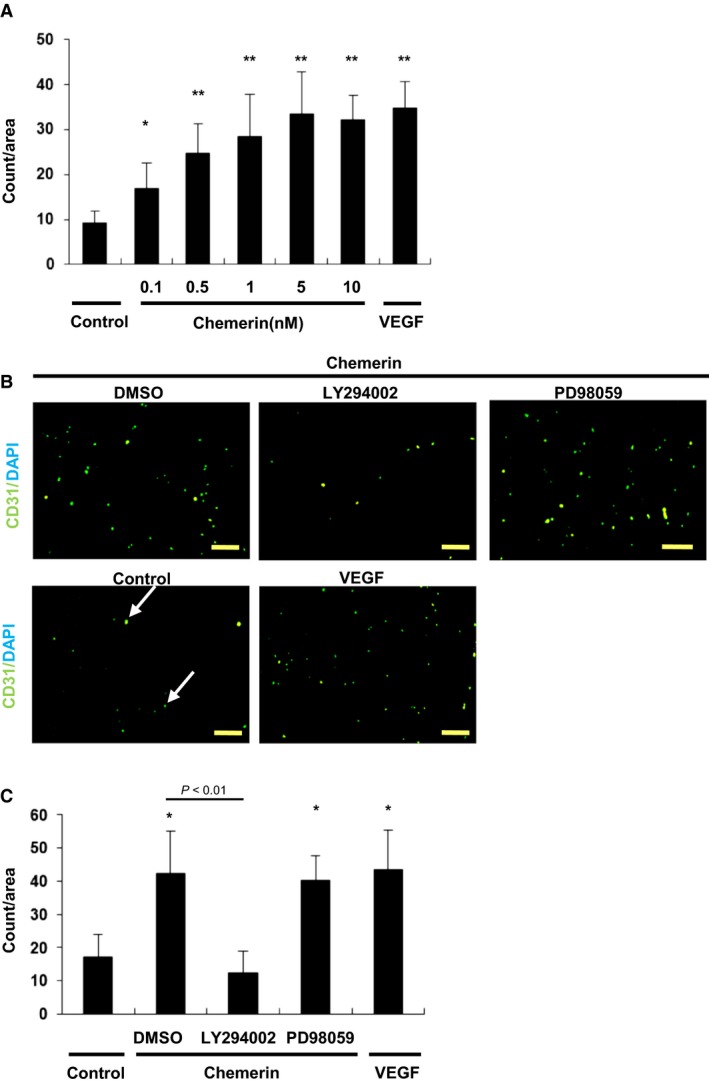
Figure 3.

Migration of HUVECs induced by chemerin. (A) Modified Boyden chamber assay was performed with chemerin (10 nmol/L) or VEGF (5 nmol/L) as chemoattractant. Chemerin stimulation (10 nmol/L) was conducted for the indicated time. Seven random microscopic fields per each well were quantified. All assays were performed in triplicate. The results are shown as the mean ± SE. *P < 0.05, **P < 0.01 versus control. (B) Representative images of the migrated HUVEC in the modified Boyden assay. Cells were stained with CD31 and DAPI (arrow indicated). Bar = 100 μm. (C) Chemerin‐induced enhancement of migration. After preincubation with LY294002 (1 μmol/L) or PD98059 (5 μmol/L), cells were incubated with chemerin (10 nmol/L). The migratory capacity was quantified by counting the migrated HUVECs on the lower surface of the filter. Seven random microscopic fields per each well were quantified. All assays were performed in triplicate. The results are shown as the mean ± SE. *P < 0.01 versus control.
