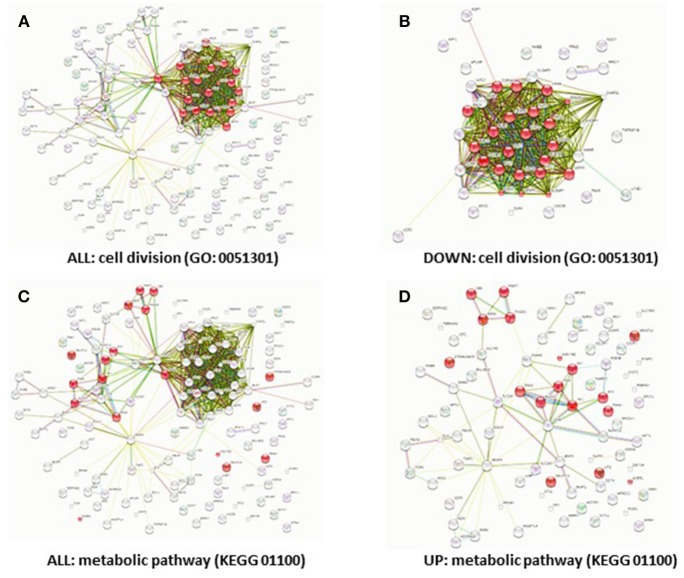
Figure 6.
Downregulation of cell cycle genes and upregulation of metabolic genes by hypoxia. Predicted protein-protein interactions show different protein clusters. Genes that were significantly differentially regulated (FDR < 5%) in hypoxia (A,C), down-regulated (B) or upregulated in hypoxia (D) were clustered based on protein-protein interactions. The nodes represent the proteins and a shared function of the proteins are shown as interconnecting lines. The genes were clustered based on the GO (0051301) cell division pathway (A,B) or the KEGG (01100) metabolic pathway; genes involved in these pathways are indicated in red.

