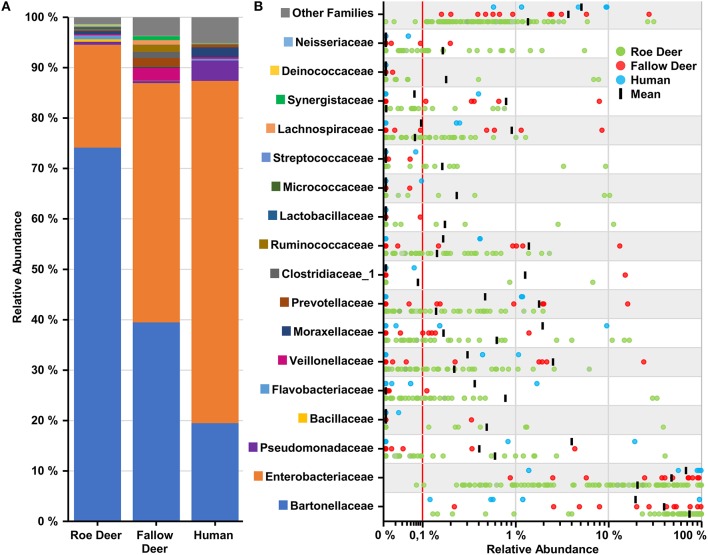
Figure 4.
Overview of top 17 families found in deer keds. (A) Cumulative bar charts comparing relative family abundances for deer keds collected from row deer, fallow deer and humans. (B) Variation in relative abundance of each family in deer keds samples. Red line shows cutoff for noise. Families not in the top 17 by relative abundance are categorized as other families.

