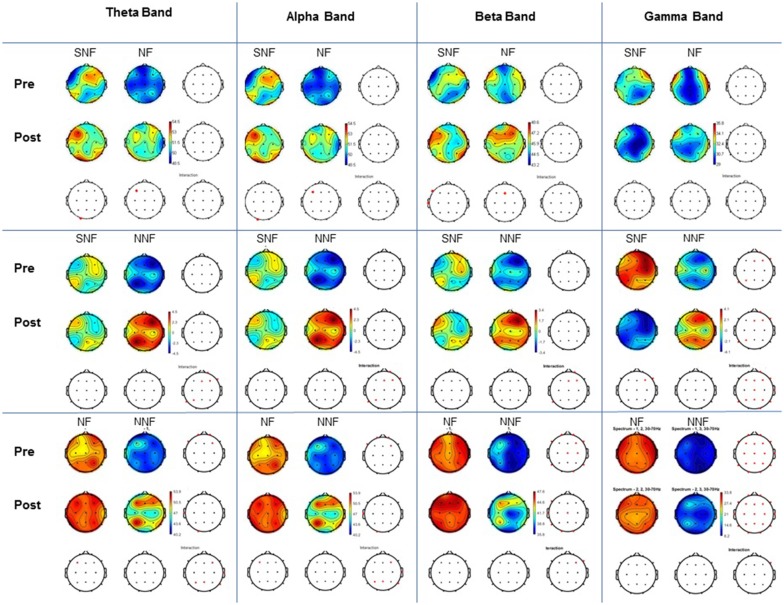
Figure 5.
Comparison between groups and condition. For each frequency band examined (Theta, Alpha, Beta and Gamma) shown in the columns, pre and post conditions are indicated in the horizontal blocks (rows). All paired comparisons for each group (SNF vs. NF, SNF vs. NNF, and NF vs. NNF) are shown in the corresponding wave bands columns. T-test with Bonferroni correction and interaction, with p < 0.05.

