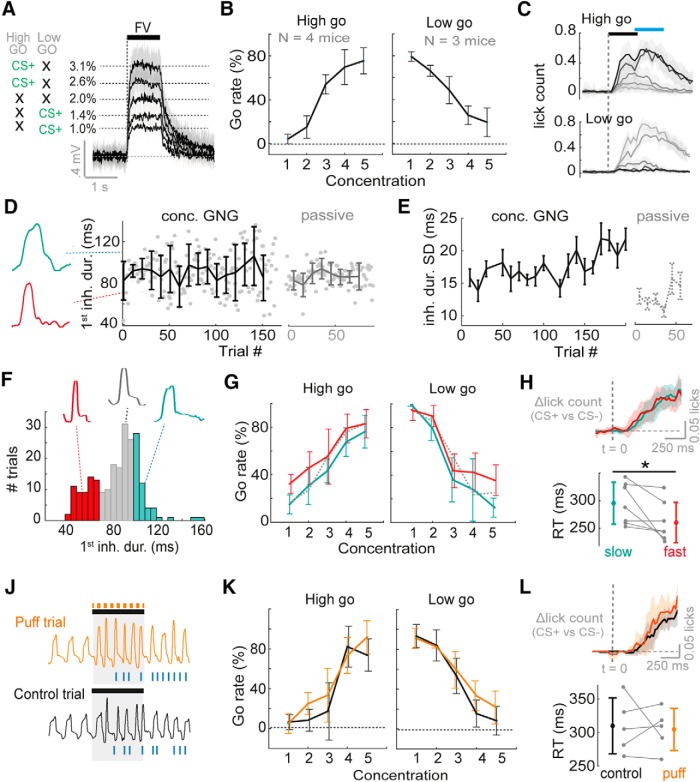
Figure 4.
Variance in inhalation has no overt impact on concentration discrimination performance. A, Diagram to show average PID traces for the five different concentrations and contingency schemes. Shaded area shows SD. To the left the contingencies are shown for “high-go” and “low-go” trained mice, with black crosses indicating CS– stimuli. B, Average go rate (percentage of trials with a go response) across mice for all five concentrations. C, Mean lick counts averaged across mice for the five different concentrations (darkest = strongest) for both “high go” and “low go” training contingencies. Black bar indicates odor stimulus, and blue bar indicates response period. D, Plot to show inhalation duration for first inhalation of the odor stimulus across trials, for the first session of one example mouse performing the five-concentration go/no-go task (“concentration GNG”), and for a passively exposed mouse (“passive”). Error bars show SD for each 10-trial block. Example representative nasal flow waveforms for single sniffs are shown to the left. E, Mean SD for the first inhalation duration (ms) during the odor stimulus, for seven mice performing five-concentration go/no-go in their first session, and for passively exposed mice (n = 23). SD is calculated for each 10-trial block of a session for each mouse. Error bars show standard error. F, Example histogram of inhalation durations of the first sniff during an odor stimulus across trials for one mouse. Data for each mouse is partitioned into fast inhalations (<30th percentile, red), slow inhalations (>70th percentile, cyan), and other (gray). Example representative nasal flow waveforms for a single sniff of each subset are shown. G, Go rate as a function of concentration when splitting trials according to duration of first inhalation as in F. Dotted line shows mean go rate for sniffs with inhalation between 30th and 70th percentile. H, Top: average difference in lick-histograms between CS+ and CS– (highest versus lowest concentration) averaged across all seven mice for slow sniff trials (cyan data) and fast sniff trials (red data) partitioned as in F. Shaded area indicates SD. Dashed line indicates odor stimulus onset aligned to the first inhalation. Bottom plot shows difference in reaction times as measured by licking for fast and slow sniff trials for all seven mice. See also Fig. 3-1D. J, Example sniff traces for one animal for a puff trial (a trial in which an air puff to the flank was used to evoke fast sniffing) and an adjacent control trial of the same concentration. Blue ticks indicate licks. K, Mean go rate as a function of concentration across mice for puff trials (orange) versus control trials (black). L, As for H, but now comparing lick distributions and reaction times between puff trials and control trials. See also Fig. 3-1E.

