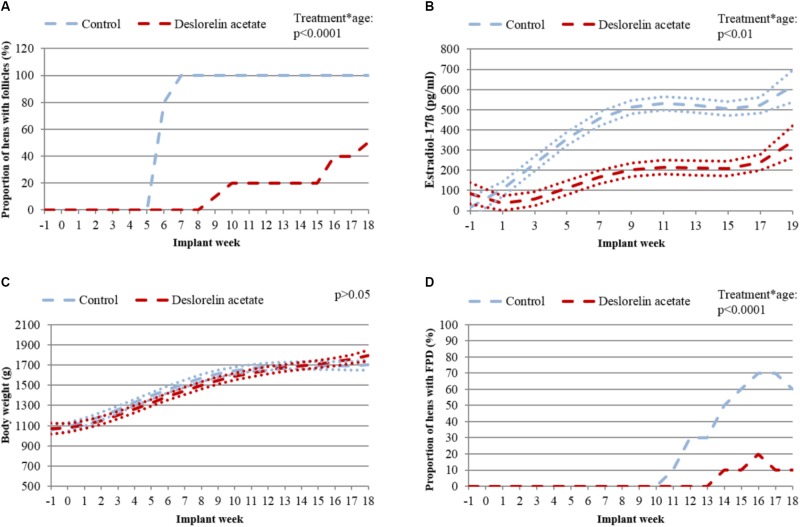
FIGURE 4.
Hens with follicles, estradiol-17ß concentrations, body weight and hens with FPD of group “Juvenile”. (A) Proportion of control (blue dashed line) and treated hens (red dashed line) with follicles on the ovary. (B) LSM (dashed lines) and upper and lower bounds of the 95% confidence interval (dotted lines) of estradiol-17ß in plasma in control (blue) and treated hens (red). Missing overlap of lines indicates a significant difference (p < 0.05) between groups. (C) LSM (dashed lines) and upper and lower bounds of the 95 % confidence interval (dotted lines) of body weight of control (blue) and treated hens (red). Overlap of lines indicates no significant difference (p > 0.05) between groups. (D) Proportion of hens with FPD of control (blue dashed line) and treated hens (red dashed line).

