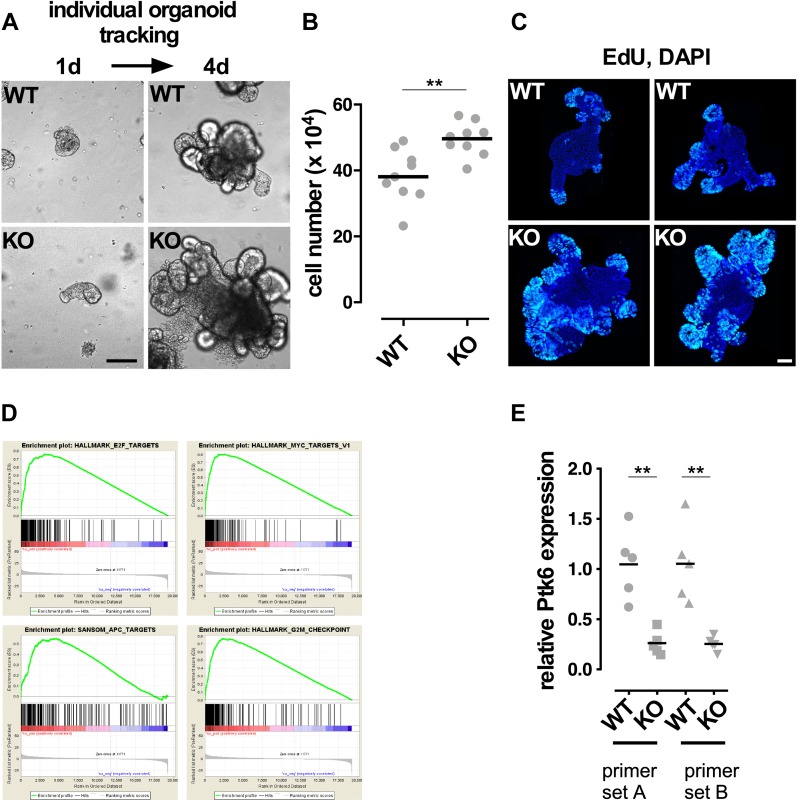
Figure 6. Analysis of C/EBPα-depleted organoids.
Comparison of control and C/EBPα-depleted small intestinal organoid cultures. C/EBPα KO was induced over 2 consecutive days by administration of 800 nM 4-OHT. (A) Brightfield images of individual tracked control and mutant organoids over a period of 4 d. (B) Measurement of total cell number increase in control and mutant Organoids over a period of 4 d (two-tailed, unpaired t test, n = 9, P < 0.05). (C) Whole-mount IF of EdU-labeled S-phase cells of control (upper) and C/EBPα-depleted (lower) small intestinal organoids. (D) GSEA of RNA sequencing expression data of control and C/EBPα-depleted small intestinal organoids: C/EBPα depletion results in enhanced expression of the E2f, Myc, and Apc target genes and G2M checkpoint genes. KO: C/EBPα-depleted. (E) Quantitative normalized PCR analysis of Ptk6 gene expression in 5 WT and C/EBPα KO organoids with two primer sets, as indicated (two-tailed, unpaired t test, n = 5, P < 0.005). Scale bars: 200 μm.

