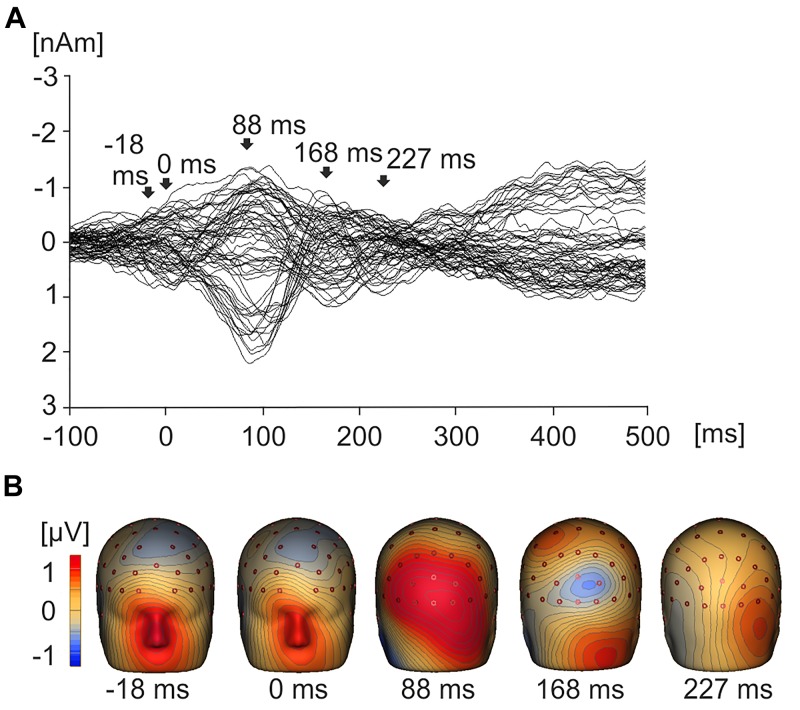
FIGURE 3.
Grand average EMRPs waveforms and topographic maps. (A) Butterfly plot showing grand average EMRPs waveforms across all subjects and all product value conditions with key points of interest highlighted with arrows. The butterfly plot demonstrates that eye movement activity is present in the baseline (–18 ms) and residual eye movement is present when the eye first touches the image (0 ms). The lambda component is highlighted (88 ms) and two later value related peaks are observed at 168 ms and 227 ms. (B) 3D whole head topographic maps displaying grand average EMRP cortical activation at key time points (–18 ms, 0 ms, 88 ms) and value related peaks (168 ms and 227 ms).

