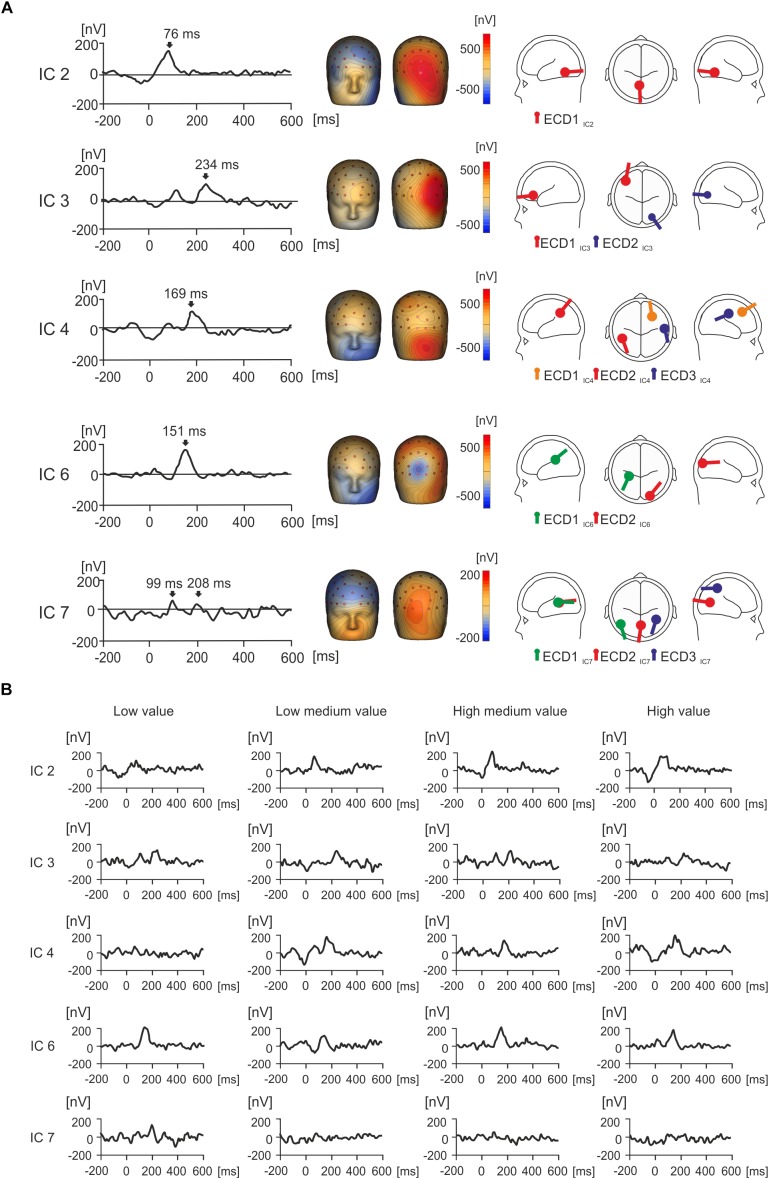
FIGURE 4.
Grand average IC activity (nV) and value. (A) Grand average waveforms for each isolated IC of interest between –200 and 600 ms, with peak activity for each component indicated with an arrow. Source dipole modeling was used to estimate equivalent current dipoles (ECDs) in order to explain the cortical sources of activation for each IC. ECDs for each IC can be observed in a glass brain showing the location and orientation of estimated cortical activity, with no more than three sources utilized. (B) The grand average waveforms for each individual IC were split by condition in order to illustrate how each IC responds to value over time.

