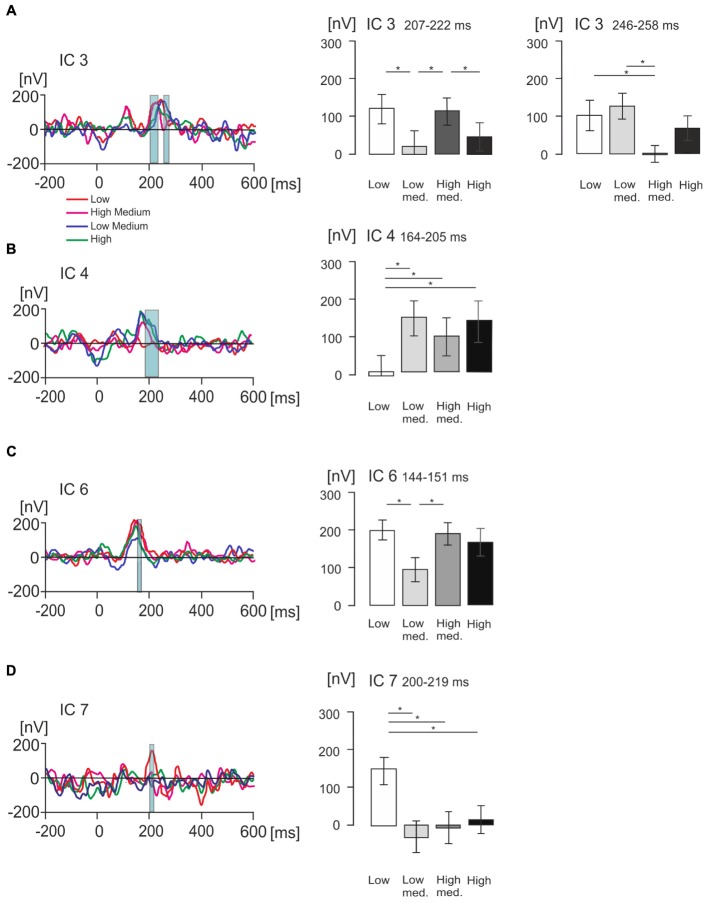
FIGURE 6.
Statistical differences in product value for ICs of interest measured in nanovolts (nV). (A–D) Figures illustrating grand average EMRP activity split across four value conditions, indicated by different colored lines, for four isolated ICs of interest including IC3, IC4, IC6 and IC7 respectively. The corresponding bar graphs illustrate differences in mean amplitude across the four subjective value conditions for each isolated IC of interest. Significant differences between mean amplitude across conditions are indicated with a single asterisk for differences significant at p < 0.05.

