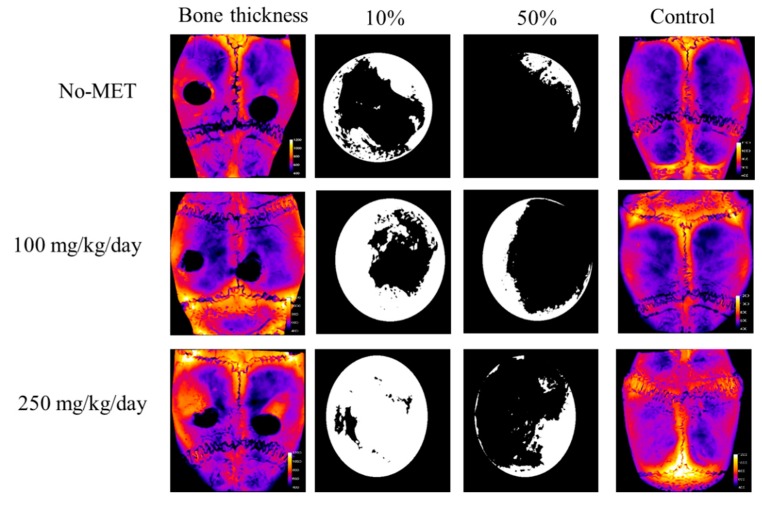
Figure 11.
Microcomputed tomography analysis of existing and newly formed bone thickness. Bone thickness presented as heat maps (based on X-ray images)—with brighter color marking increasing bone thickness. Black and white images showing the left burr hole from the respective skull—white color shows the area of the burr hole covered by newly formed bone. 10%—burr hole covered by newly formed bone (white) which in terms of burr hole depth penetrates at least to 10% of the total burr hole depth. 50%—burr hole covered by newly formed bone (white), which in terms of burr hole depth penetrates at least to 50% of the total burr hole depth. No-met—group not receiving metformin, 100—group receiving 100 mg of metformin per day, 250—group receiving 250 mg of metformin per day.

