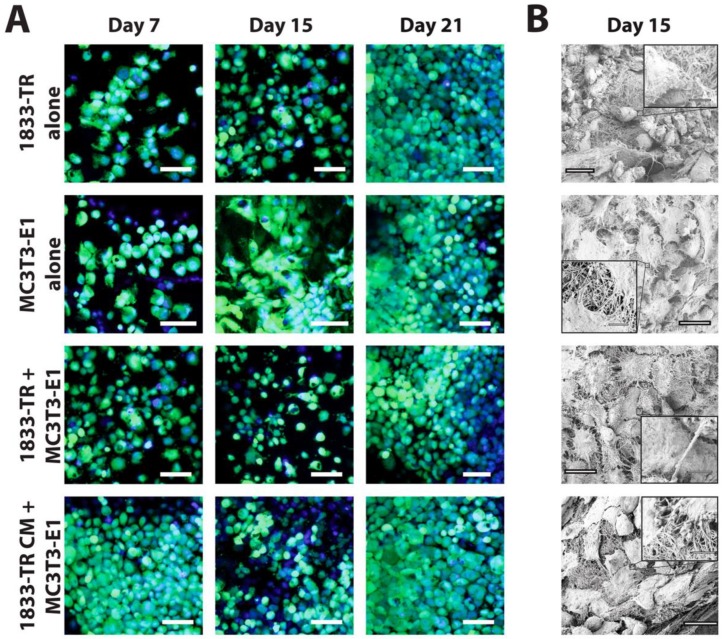
Figure 2.
Cellularization of DC gels. (A) Cellularity of DC constructs visualized by confocal laser scanning microscopy (CLSM). Cell bodies (green, Calcein AM) and nuclei (blue, Hoechst 33342) were visualized at days 7, 15, and 21 in culture. DC constructs employing 1833-TR CM or co-culture approaches are indicated. Scale bars represent 55 µm for magnified images at 40×. (B) SEM micrographs at day 15 in culture depicting cuboidal (1833-TR) and spindle-like (MC3T3-E1) cellular morphologies. Scale bars represent 20 µm (large image) or 250 nm (image insets).

